29
/pt/
pt
AIzaSyAYiBZKx7MnpbEhh9jyipgxe19OcubqV5w
April 1, 2024
110805
Congo, Rep.
COG
true
2
1
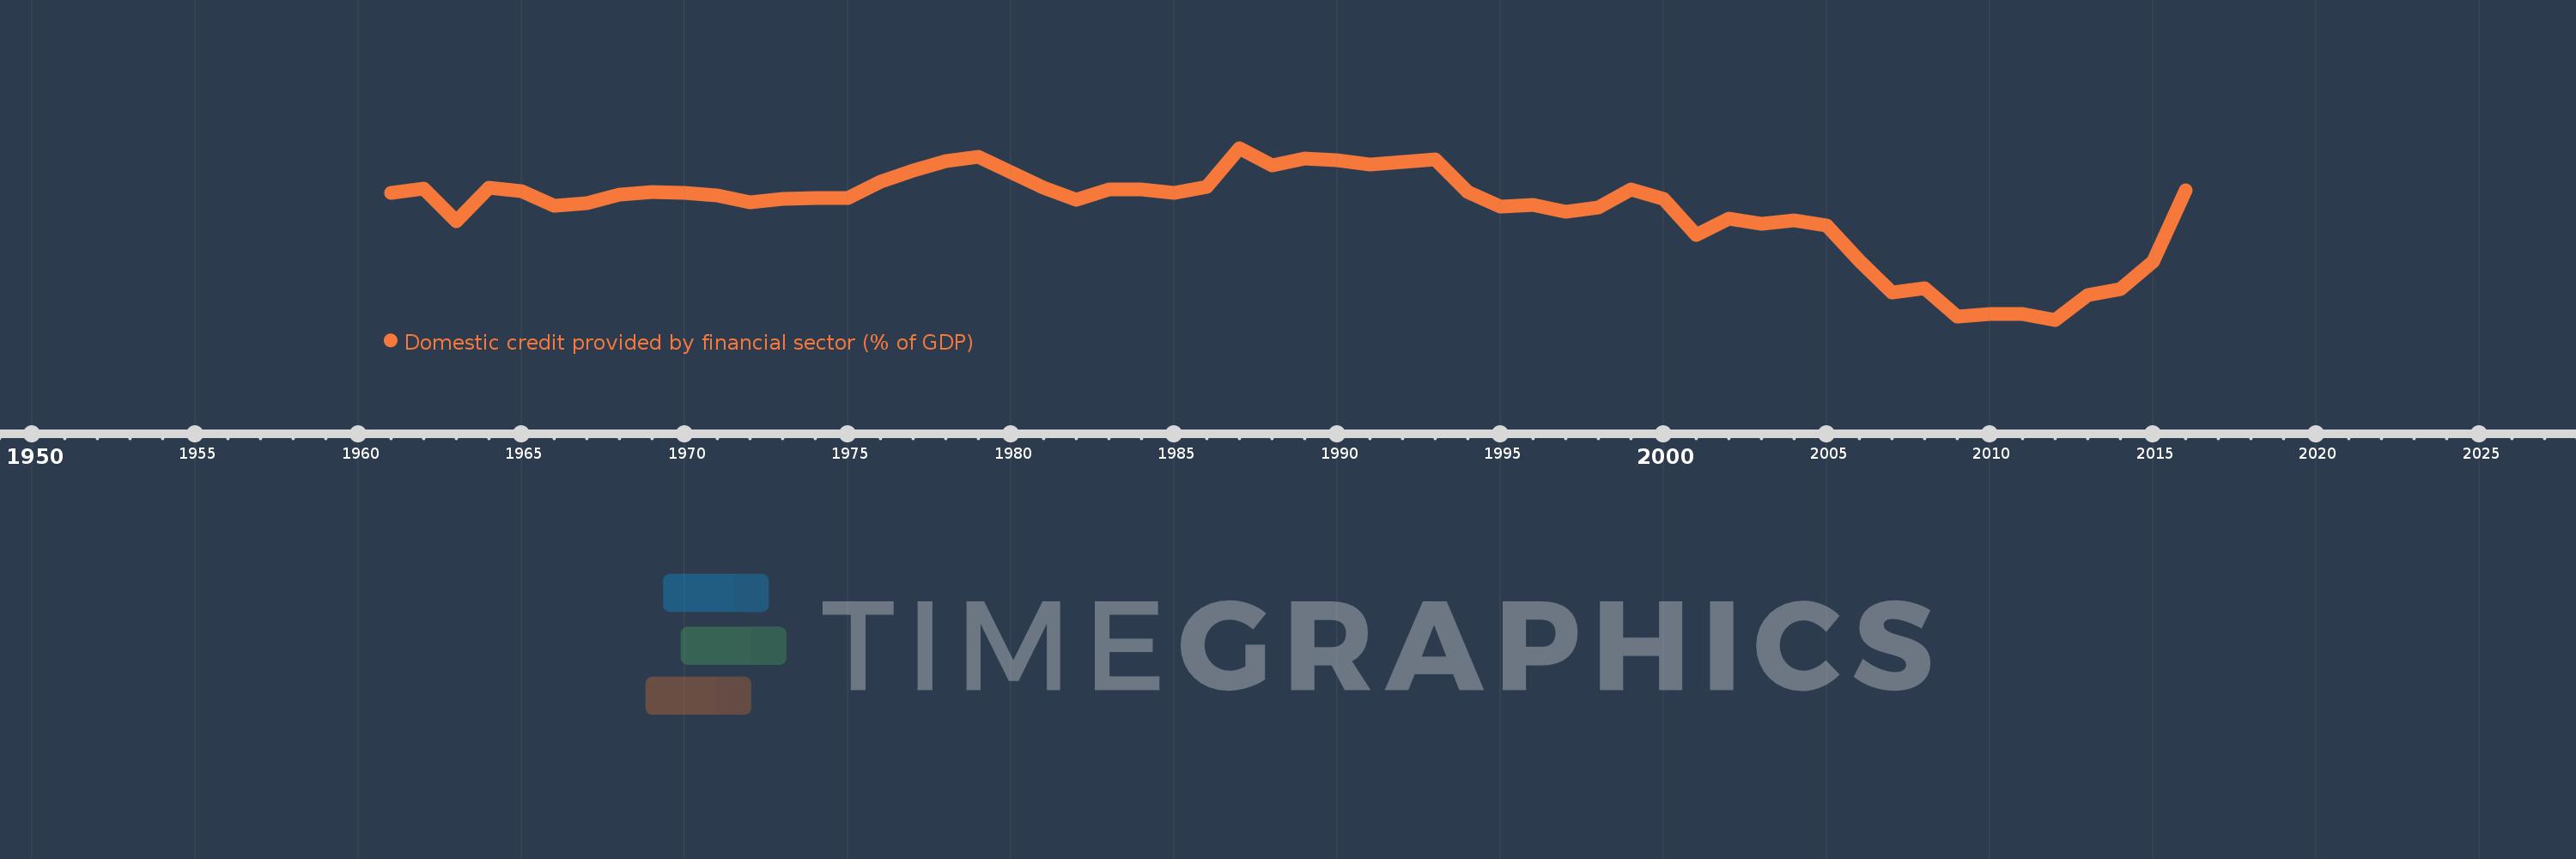
Domestic credit provided by financial sector (% of GDP)
2016,2015,2014,2013,2012,2011,2010,2009,2008,2007,2006,2005,2004,2003,2002,2001,2000,1999,1998,1997,1996,1995,1994,1993,1992,1991,1990,1989,1988,1987,1986,1985,1984,1983,1982,1981,1980,1979,1978,1977,1976,1975,1974,1973,1972,1971,1970,1969,1968,1967,1966,1965,1964,1963,1962,1961
Estas estatísticas em outros países:
AfghanistanAlbaniaAlgeriaAngolaAntigua and BarbudaArab WorldArgentinaArmeniaArubaAustraliaAustriaAzerbaijanBahamas, TheBahrainBangladeshBarbadosBelarusBelgiumBelizeBeninBhutanBoliviaBosnia and HerzegovinaBotswanaBrazilBrunei DarussalamBulgariaBurkina FasoBurundiCabo VerdeCambodiaCameroonCanadaCaribbean small statesCentral African RepublicCentral Europe and the BalticsChadChileChinaColombiaComorosCongo, Dem. Rep.Congo, Rep.Costa RicaCote d'IvoireCroatiaCyprusCzech RepublicDenmarkDjiboutiDominicaDominican RepublicEarly-demographic dividendEast Asia & PacificEast Asia & Pacific (excluding high income)East Asia & Pacific (IDA & IBRD countries)EcuadorEgypt, Arab Rep.El SalvadorEquatorial GuineaEritreaEstoniaEthiopiaEuro areaEurope & Central AsiaEurope & Central Asia (excluding high income)Europe & Central Asia (IDA & IBRD countries)European UnionFijiFinlandFragile and conflict affected situationsFranceGabonGambia, TheGeorgiaGermanyGhanaGreeceGrenadaGuatemalaGuineaGuinea-BissauGuyanaHaitiHeavily indebted poor countries (HIPC)High incomeHondurasHong Kong SAR, ChinaHungaryIBRD onlyIcelandIDA & IBRD totalIDA blendIDA onlyIDA totalIndiaIndonesiaIran, Islamic Rep.IraqIrelandIsraelItalyJamaicaJapanJordanKazakhstanKenyaKorea, Rep.KosovoKuwaitKyrgyz RepublicLao PDRLate-demographic dividendLatin America & Caribbean Latin America & Caribbean (excluding high income)Latin America & the Caribbean (IDA & IBRD countries)LatviaLeast developed countries: UN classificationLebanonLesothoLiberiaLibyaLithuaniaLow & middle incomeLow incomeLower middle incomeLuxembourgMacao SAR, ChinaMacedonia, FYRMadagascarMalawiMalaysiaMaldivesMaliMaltaMauritaniaMauritiusMexicoMicronesia, Fed. Sts.Middle East & North AfricaMiddle East & North Africa (excluding high income)Middle East & North Africa (IDA & IBRD countries)Middle incomeMoldovaMongoliaMontenegroMoroccoMozambiqueMyanmarNamibiaNepalNetherlandsNew ZealandNicaraguaNigerNigeriaNorth AmericaNorwayOECD membersOmanOther small statesPacific island small statesPakistanPanamaPapua New GuineaParaguayPeruPhilippinesPolandPortugalPost-demographic dividendPre-demographic dividendQatarRomaniaRussian FederationRwandaSamoaSao Tome and PrincipeSaudi ArabiaSenegalSerbiaSeychellesSierra LeoneSingaporeSlovak RepublicSloveniaSmall statesSolomon IslandsSouth AfricaSouth AsiaSouth Asia (IDA & IBRD)South SudanSpainSri LankaSt. Kitts and NevisSt. LuciaSt. Vincent and the GrenadinesSub-Saharan Africa Sub-Saharan Africa (excluding high income)Sub-Saharan Africa (IDA & IBRD countries)SudanSurinameSwazilandSwedenSwitzerlandSyrian Arab RepublicTajikistanTanzaniaThailandTimor-LesteTogoTongaTrinidad and TobagoTunisiaTurkeyUgandaUkraineUnited Arab EmiratesUnited KingdomUnited StatesUpper middle incomeUruguayVanuatuVenezuela, RBVietnamWest Bank and GazaWorldYemen, Rep.ZambiaZimbabwe Linha do tempo:
Nesta escala de tempo está apresentado um gráfico de 1961 ano até 2016 ano Congo, Rep.. Dados de 1960 ano ausente. O número de observações reais por data: 56.
Fonte (nome):
Indicadores de desenvolvimento mundial
Fonte (organização):
International Monetary Fund, International Financial Statistics and data files, and World Bank and OECD GDP estimates.
Categorias:
Financial Sector
Foi atualizado:
23 abr 2017 ano
Indicadores de alterações dos valores ao longo dos anos
Mínimo:
-16.134
1 jan 2012 ano
Máximo:
33.997
1 jan 1987 ano
Na data de observação
Valor
Mudança absoluta
A alteração em relação ao valor anterior
1 jan 1961 ano
20.96
+20.96
0.0%
1 jan 1962 ano
22.097
+1.137
5.42%
1 jan 1963 ano
12.598
-9.499
-42.99%
1 jan 1964 ano
22.275
+9.677
76.81%
1 jan 1965 ano
21.363
-0.912
-4.1%
1 jan 1966 ano
17.14
-4.223
-19.77%
1 jan 1967 ano
17.989
+0.849
4.95%
1 jan 1968 ano
20.394
+2.405
13.37%
1 jan 1969 ano
21.178
+0.785
3.85%
1 jan 1970 ano
20.897
-0.281
-1.33%
1 jan 1971 ano
20.092
-0.805
-3.85%
1 jan 1972 ano
18.212
-1.88
-9.36%
1 jan 1973 ano
19.07
+0.858
4.71%
1 jan 1974 ano
19.348
+0.278
1.46%
1 jan 1975 ano
19.452
+0.104
0.54%
1 jan 1976 ano
24.079
+4.627
23.79%
1 jan 1977 ano
27.288
+3.209
13.33%
1 jan 1978 ano
30.241
+2.953
10.82%
1 jan 1979 ano
31.43
+1.189
3.93%
1 jan 1980 ano
26.837
-4.593
-14.61%
1 jan 1981 ano
22.308
-4.529
-16.88%
1 jan 1982 ano
18.785
-3.522
-15.79%
1 jan 1983 ano
21.863
+3.077
16.38%
1 jan 1984 ano
22.006
+0.143
0.66%
1 jan 1985 ano
20.99
-1.016
-4.62%
1 jan 1986 ano
22.693
+1.703
8.11%
1 jan 1987 ano
33.997
+11.304
49.81%
1 jan 1988 ano
28.82
-5.177
-15.23%
1 jan 1989 ano
30.883
+2.063
7.16%
1 jan 1990 ano
30.308
-0.575
-1.86%
1 jan 1991 ano
29.142
-1.167
-3.85%
1 jan 1992 ano
29.87
+0.729
2.5%
1 jan 1993 ano
30.618
+0.748
2.5%
1 jan 1994 ano
21.135
-9.482
-30.97%
1 jan 1995 ano
16.896
-4.239
-20.06%
1 jan 1996 ano
17.33
+0.434
2.57%
1 jan 1997 ano
15.264
-2.066
-11.92%
1 jan 1998 ano
16.729
+1.465
9.6%
1 jan 1999 ano
21.974
+5.245
31.35%
1 jan 2000 ano
19.041
-2.933
-13.35%
1 jan 2001 ano
8.651
-10.39
-54.57%
1 jan 2002 ano
13.343
+4.692
54.24%
1 jan 2003 ano
11.835
-1.508
-11.3%
1 jan 2004 ano
12.966
+1.131
9.56%
1 jan 2005 ano
11.342
-1.624
-12.52%
1 jan 2006 ano
1.104
-10.239
-90.27%
1 jan 2007 ano
-8.279
-9.383
-850.13%
1 jan 2008 ano
-6.851
+1.428
-17.25%
1 jan 2009 ano
-15.246
-8.395
122.54%
1 jan 2010 ano
-14.361
+0.885
-5.8%
1 jan 2011 ano
-14.342
+0.02
-0.14%
1 jan 2012 ano
-16.134
-1.793
12.5%
1 jan 2013 ano
-8.933
+7.201
-44.63%
1 jan 2014 ano
-7.236
+1.697
-19.0%
1 jan 2015 ano
0.815
+8.05
-111.26%
1 jan 2016 ano
21.525
+20.711
2.54 mil%
Classificação de países por estatísticas atuais por anos


Comentários: