29
/pt/
pt
AIzaSyAYiBZKx7MnpbEhh9jyipgxe19OcubqV5w
April 1, 2024
218178
Panama
PAN
true
2
1
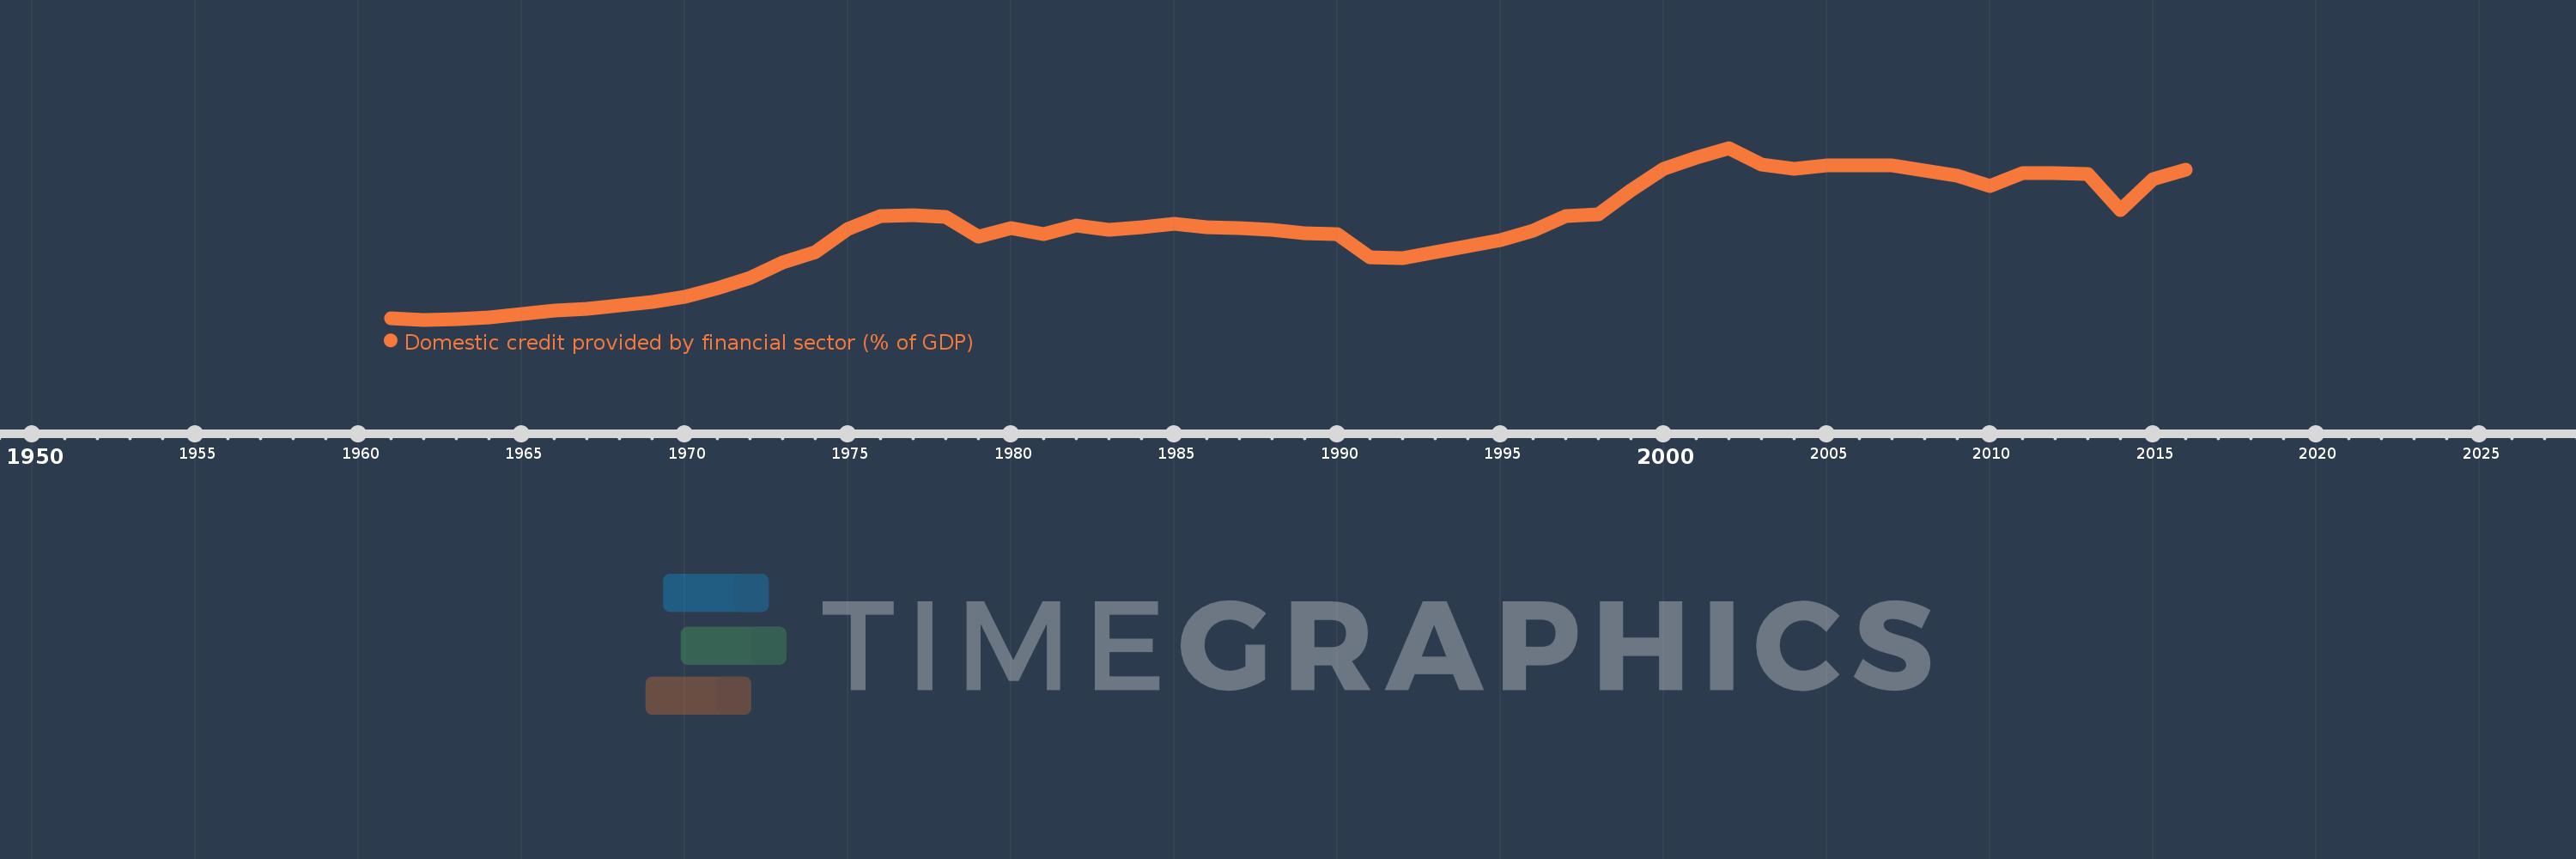
Domestic credit provided by financial sector (% of GDP)
2016,2015,2014,2013,2012,2011,2010,2009,2008,2007,2006,2005,2004,2003,2002,2001,2000,1999,1998,1997,1996,1995,1994,1993,1992,1991,1990,1989,1988,1987,1986,1985,1984,1983,1982,1981,1980,1979,1978,1977,1976,1975,1974,1973,1972,1971,1970,1969,1968,1967,1966,1965,1964,1963,1962,1961
Estas estatísticas em outros países:
AfghanistanAlbaniaAlgeriaAngolaAntigua and BarbudaArab WorldArgentinaArmeniaArubaAustraliaAustriaAzerbaijanBahamas, TheBahrainBangladeshBarbadosBelarusBelgiumBelizeBeninBhutanBoliviaBosnia and HerzegovinaBotswanaBrazilBrunei DarussalamBulgariaBurkina FasoBurundiCabo VerdeCambodiaCameroonCanadaCaribbean small statesCentral African RepublicCentral Europe and the BalticsChadChileChinaColombiaComorosCongo, Dem. Rep.Congo, Rep.Costa RicaCote d'IvoireCroatiaCyprusCzech RepublicDenmarkDjiboutiDominicaDominican RepublicEarly-demographic dividendEast Asia & PacificEast Asia & Pacific (excluding high income)East Asia & Pacific (IDA & IBRD countries)EcuadorEgypt, Arab Rep.El SalvadorEquatorial GuineaEritreaEstoniaEthiopiaEuro areaEurope & Central AsiaEurope & Central Asia (excluding high income)Europe & Central Asia (IDA & IBRD countries)European UnionFijiFinlandFragile and conflict affected situationsFranceGabonGambia, TheGeorgiaGermanyGhanaGreeceGrenadaGuatemalaGuineaGuinea-BissauGuyanaHaitiHeavily indebted poor countries (HIPC)High incomeHondurasHong Kong SAR, ChinaHungaryIBRD onlyIcelandIDA & IBRD totalIDA blendIDA onlyIDA totalIndiaIndonesiaIran, Islamic Rep.IraqIrelandIsraelItalyJamaicaJapanJordanKazakhstanKenyaKorea, Rep.KosovoKuwaitKyrgyz RepublicLao PDRLate-demographic dividendLatin America & Caribbean Latin America & Caribbean (excluding high income)Latin America & the Caribbean (IDA & IBRD countries)LatviaLeast developed countries: UN classificationLebanonLesothoLiberiaLibyaLithuaniaLow & middle incomeLow incomeLower middle incomeLuxembourgMacao SAR, ChinaMacedonia, FYRMadagascarMalawiMalaysiaMaldivesMaliMaltaMauritaniaMauritiusMexicoMicronesia, Fed. Sts.Middle East & North AfricaMiddle East & North Africa (excluding high income)Middle East & North Africa (IDA & IBRD countries)Middle incomeMoldovaMongoliaMontenegroMoroccoMozambiqueMyanmarNamibiaNepalNetherlandsNew ZealandNicaraguaNigerNigeriaNorth AmericaNorwayOECD membersOmanOther small statesPacific island small statesPakistanPanamaPapua New GuineaParaguayPeruPhilippinesPolandPortugalPost-demographic dividendPre-demographic dividendQatarRomaniaRussian FederationRwandaSamoaSao Tome and PrincipeSaudi ArabiaSenegalSerbiaSeychellesSierra LeoneSingaporeSlovak RepublicSloveniaSmall statesSolomon IslandsSouth AfricaSouth AsiaSouth Asia (IDA & IBRD)South SudanSpainSri LankaSt. Kitts and NevisSt. LuciaSt. Vincent and the GrenadinesSub-Saharan Africa Sub-Saharan Africa (excluding high income)Sub-Saharan Africa (IDA & IBRD countries)SudanSurinameSwazilandSwedenSwitzerlandSyrian Arab RepublicTajikistanTanzaniaThailandTimor-LesteTogoTongaTrinidad and TobagoTunisiaTurkeyUgandaUkraineUnited Arab EmiratesUnited KingdomUnited StatesUpper middle incomeUruguayVanuatuVenezuela, RBVietnamWest Bank and GazaWorldYemen, Rep.ZambiaZimbabwe Linha do tempo:
Nesta escala de tempo está apresentado um gráfico de 1961 ano até 2016 ano Panama. Dados de 1960 ano ausente. O número de observações reais por data: 56.
Fonte (nome):
Indicadores de desenvolvimento mundial
Fonte (organização):
International Monetary Fund, International Financial Statistics and data files, and World Bank and OECD GDP estimates.
Categorias:
Financial Sector
Foi atualizado:
23 abr 2017 ano
Indicadores de alterações dos valores ao longo dos anos
Mínimo:
14.724
1 jan 1962 ano
Máximo:
93.47
1 jan 2002 ano
Na data de observação
Valor
Mudança absoluta
A alteração em relação ao valor anterior
1 jan 1961 ano
15.471
+15.471
0.0%
1 jan 1962 ano
14.724
-0.747
-4.83%
1 jan 1963 ano
14.875
+0.151
1.02%
1 jan 1964 ano
15.828
+0.953
6.41%
1 jan 1965 ano
17.213
+1.386
8.76%
1 jan 1966 ano
18.78
+1.567
9.1%
1 jan 1967 ano
19.831
+1.051
5.6%
1 jan 1968 ano
21.414
+1.583
7.98%
1 jan 1969 ano
22.754
+1.34
6.26%
1 jan 1970 ano
25.162
+2.408
10.58%
1 jan 1971 ano
29.104
+3.943
15.67%
1 jan 1972 ano
33.86
+4.756
16.34%
1 jan 1973 ano
40.934
+7.074
20.89%
1 jan 1974 ano
45.548
+4.614
11.27%
1 jan 1975 ano
56.468
+10.92
23.97%
1 jan 1976 ano
62.062
+5.594
9.91%
1 jan 1977 ano
62.64
+0.578
0.93%
1 jan 1978 ano
61.696
-0.944
-1.51%
1 jan 1979 ano
52.713
-8.983
-14.56%
1 jan 1980 ano
56.852
+4.139
7.85%
1 jan 1981 ano
53.948
-2.904
-5.11%
1 jan 1982 ano
57.891
+3.943
7.31%
1 jan 1983 ano
55.832
-2.058
-3.56%
1 jan 1984 ano
57.07
+1.238
2.22%
1 jan 1985 ano
58.691
+1.621
2.84%
1 jan 1986 ano
57.245
-1.446
-2.46%
1 jan 1987 ano
56.721
-0.524
-0.92%
1 jan 1988 ano
55.84
-0.881
-1.55%
1 jan 1989 ano
54.562
-1.278
-2.29%
1 jan 1990 ano
54.036
-0.526
-0.96%
1 jan 1991 ano
43.496
-10.54
-19.51%
1 jan 1992 ano
43.138
-0.358
-0.82%
1 jan 1993 ano
45.759
+2.621
6.08%
1 jan 1994 ano
48.5
+2.741
5.99%
1 jan 1995 ano
51.16
+2.659
5.48%
1 jan 1996 ano
55.582
+4.422
8.64%
1 jan 1997 ano
62.178
+6.597
11.87%
1 jan 1998 ano
62.895
+0.717
1.15%
1 jan 1999 ano
73.946
+11.051
17.57%
1 jan 2000 ano
83.977
+10.032
13.57%
1 jan 2001 ano
89.047
+5.07
6.04%
1 jan 2002 ano
93.47
+4.423
4.97%
1 jan 2003 ano
85.994
-7.475
-8.0%
1 jan 2004 ano
83.882
-2.112
-2.46%
1 jan 2005 ano
85.314
+1.432
1.71%
1 jan 2006 ano
85.301
-0.013
-0.02%
1 jan 2007 ano
85.601
+0.3
0.35%
1 jan 2008 ano
82.954
-2.647
-3.09%
1 jan 2009 ano
80.746
-2.208
-2.66%
1 jan 2010 ano
75.846
-4.9
-6.07%
1 jan 2011 ano
81.837
+5.992
7.9%
1 jan 2012 ano
81.817
-0.021
-0.03%
1 jan 2013 ano
81.36
-0.457
-0.56%
1 jan 2014 ano
64.997
-16.363
-20.11%
1 jan 2015 ano
79.218
+14.221
21.88%
1 jan 2016 ano
83.468
+4.25
5.36%
Classificação de países por estatísticas atuais por anos


Comentários: