29
/pt/
pt
AIzaSyAYiBZKx7MnpbEhh9jyipgxe19OcubqV5w
April 1, 2024
161337
Italy
ITA
true
2
1
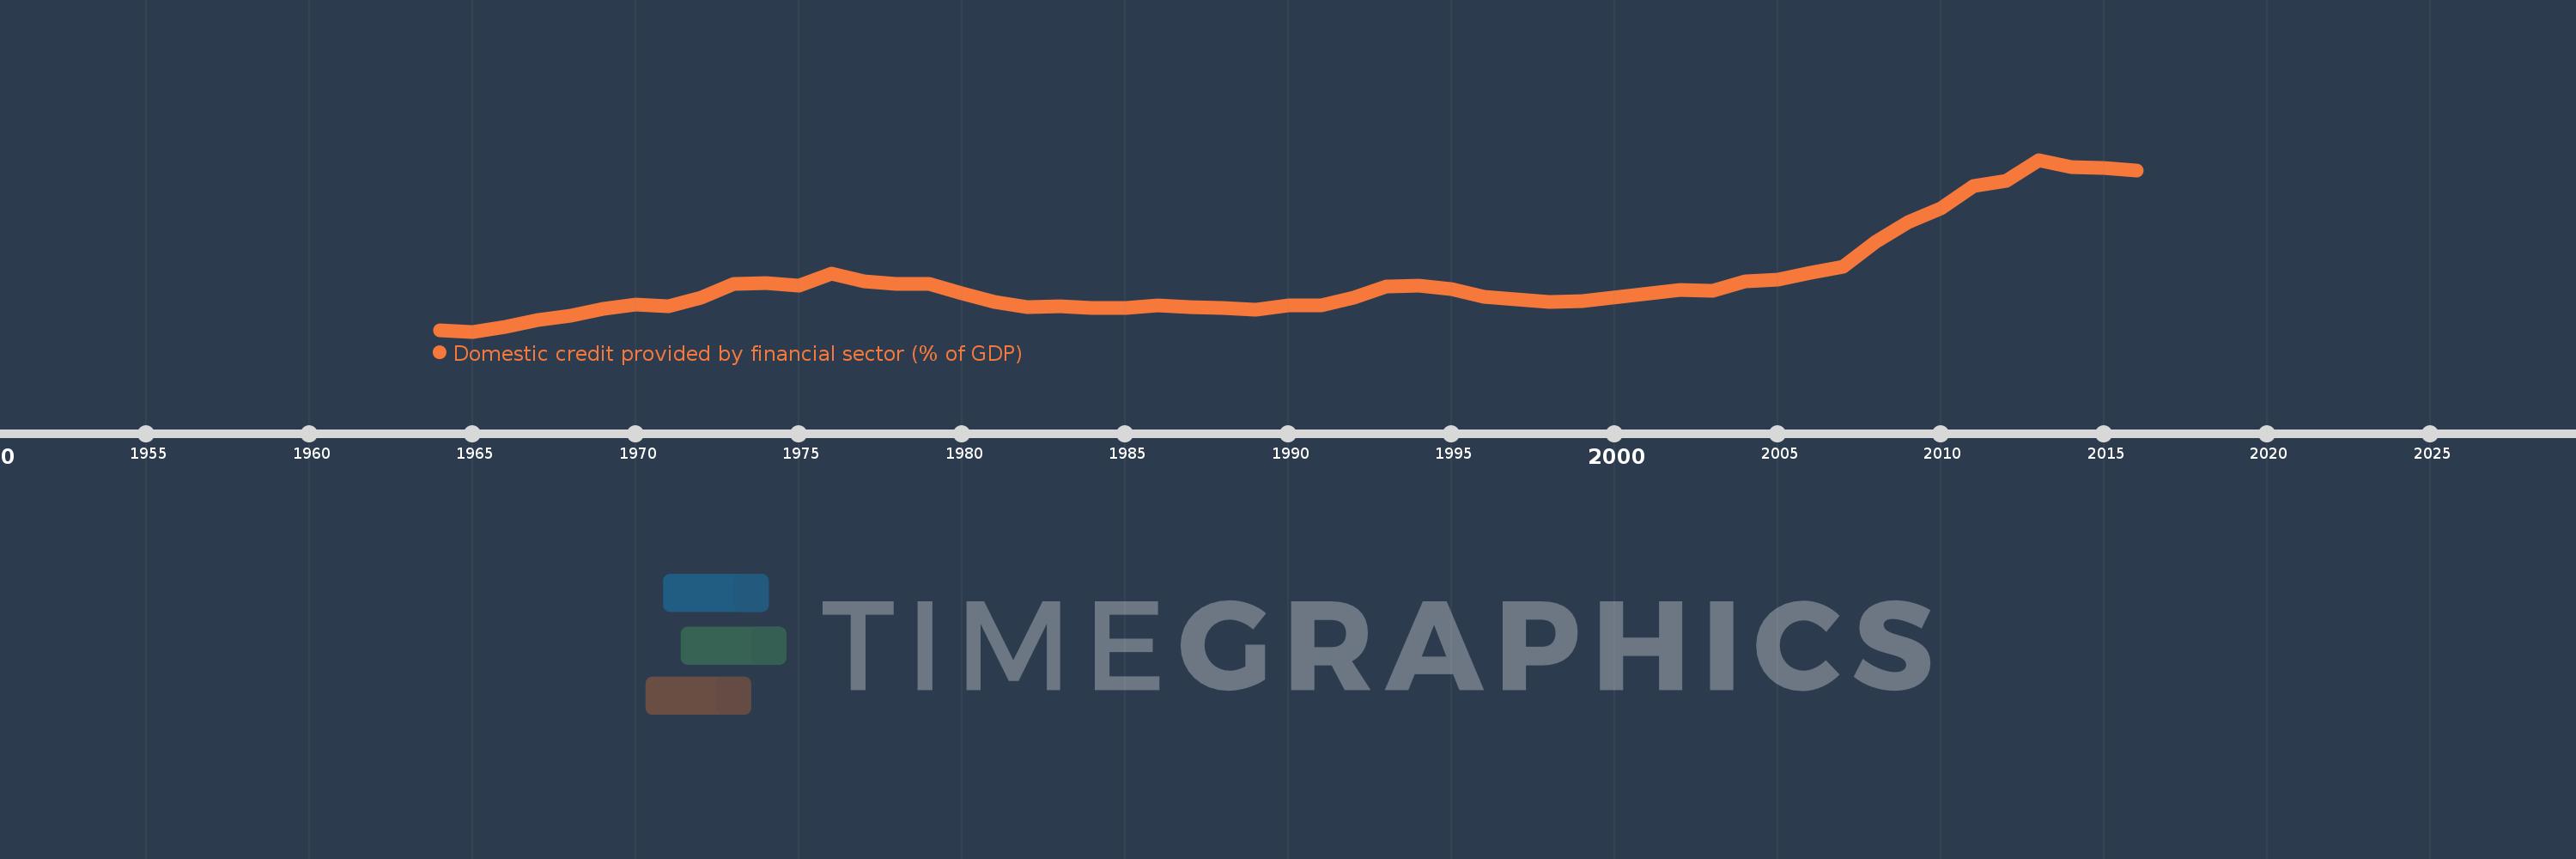
Domestic credit provided by financial sector (% of GDP)
2016,2015,2014,2013,2012,2011,2010,2009,2008,2007,2006,2005,2004,2003,2002,1999,1998,1997,1996,1995,1994,1993,1992,1991,1990,1989,1988,1987,1986,1985,1984,1983,1982,1981,1980,1979,1978,1977,1976,1975,1974,1973,1972,1971,1970,1969,1968,1967,1966,1965,1964
Estas estatísticas em outros países:
AfghanistanAlbaniaAlgeriaAngolaAntigua and BarbudaArab WorldArgentinaArmeniaArubaAustraliaAustriaAzerbaijanBahamas, TheBahrainBangladeshBarbadosBelarusBelgiumBelizeBeninBhutanBoliviaBosnia and HerzegovinaBotswanaBrazilBrunei DarussalamBulgariaBurkina FasoBurundiCabo VerdeCambodiaCameroonCanadaCaribbean small statesCentral African RepublicCentral Europe and the BalticsChadChileChinaColombiaComorosCongo, Dem. Rep.Congo, Rep.Costa RicaCote d'IvoireCroatiaCyprusCzech RepublicDenmarkDjiboutiDominicaDominican RepublicEarly-demographic dividendEast Asia & PacificEast Asia & Pacific (excluding high income)East Asia & Pacific (IDA & IBRD countries)EcuadorEgypt, Arab Rep.El SalvadorEquatorial GuineaEritreaEstoniaEthiopiaEuro areaEurope & Central AsiaEurope & Central Asia (excluding high income)Europe & Central Asia (IDA & IBRD countries)European UnionFijiFinlandFragile and conflict affected situationsFranceGabonGambia, TheGeorgiaGermanyGhanaGreeceGrenadaGuatemalaGuineaGuinea-BissauGuyanaHaitiHeavily indebted poor countries (HIPC)High incomeHondurasHong Kong SAR, ChinaHungaryIBRD onlyIcelandIDA & IBRD totalIDA blendIDA onlyIDA totalIndiaIndonesiaIran, Islamic Rep.IraqIrelandIsraelItalyJamaicaJapanJordanKazakhstanKenyaKorea, Rep.KosovoKuwaitKyrgyz RepublicLao PDRLate-demographic dividendLatin America & Caribbean Latin America & Caribbean (excluding high income)Latin America & the Caribbean (IDA & IBRD countries)LatviaLeast developed countries: UN classificationLebanonLesothoLiberiaLibyaLithuaniaLow & middle incomeLow incomeLower middle incomeLuxembourgMacao SAR, ChinaMacedonia, FYRMadagascarMalawiMalaysiaMaldivesMaliMaltaMauritaniaMauritiusMexicoMicronesia, Fed. Sts.Middle East & North AfricaMiddle East & North Africa (excluding high income)Middle East & North Africa (IDA & IBRD countries)Middle incomeMoldovaMongoliaMontenegroMoroccoMozambiqueMyanmarNamibiaNepalNetherlandsNew ZealandNicaraguaNigerNigeriaNorth AmericaNorwayOECD membersOmanOther small statesPacific island small statesPakistanPanamaPapua New GuineaParaguayPeruPhilippinesPolandPortugalPost-demographic dividendPre-demographic dividendQatarRomaniaRussian FederationRwandaSamoaSao Tome and PrincipeSaudi ArabiaSenegalSerbiaSeychellesSierra LeoneSingaporeSlovak RepublicSloveniaSmall statesSolomon IslandsSouth AfricaSouth AsiaSouth Asia (IDA & IBRD)South SudanSpainSri LankaSt. Kitts and NevisSt. LuciaSt. Vincent and the GrenadinesSub-Saharan Africa Sub-Saharan Africa (excluding high income)Sub-Saharan Africa (IDA & IBRD countries)SudanSurinameSwazilandSwedenSwitzerlandSyrian Arab RepublicTajikistanTanzaniaThailandTimor-LesteTogoTongaTrinidad and TobagoTunisiaTurkeyUgandaUkraineUnited Arab EmiratesUnited KingdomUnited StatesUpper middle incomeUruguayVanuatuVenezuela, RBVietnamWest Bank and GazaWorldYemen, Rep.ZambiaZimbabwe Linha do tempo:
Nesta escala de tempo está apresentado um gráfico de 1964 ano até 2016 ano Italy. Dados de 1963 ano ausente. O número de observações reais por data: 51.
Fonte (nome):
Indicadores de desenvolvimento mundial
Fonte (organização):
International Monetary Fund, International Financial Statistics and data files, and World Bank and OECD GDP estimates.
Categorias:
Financial Sector
Foi atualizado:
23 abr 2017 ano
Indicadores de alterações dos valores ao longo dos anos
Mínimo:
67.072
1 jan 1965 ano
Máximo:
177.392
1 jan 2013 ano
Na data de observação
Valor
Mudança absoluta
A alteração em relação ao valor anterior
1 jan 1964 ano
67.653
+67.653
0.0%
1 jan 1965 ano
67.072
-0.582
-0.86%
1 jan 1966 ano
70.206
+3.134
4.67%
1 jan 1967 ano
74.625
+4.419
6.29%
1 jan 1968 ano
77.394
+2.769
3.71%
1 jan 1969 ano
81.426
+4.032
5.21%
1 jan 1970 ano
84.175
+2.749
3.38%
1 jan 1971 ano
83.441
-0.734
-0.87%
1 jan 1972 ano
89.042
+5.601
6.71%
1 jan 1973 ano
97.576
+8.534
9.58%
1 jan 1974 ano
98.31
+0.734
0.75%
1 jan 1975 ano
96.637
-1.674
-1.7%
1 jan 1976 ano
104.372
+7.736
8.0%
1 jan 1977 ano
99.591
-4.781
-4.58%
1 jan 1978 ano
97.792
-1.799
-1.81%
1 jan 1979 ano
97.549
-0.244
-0.25%
1 jan 1980 ano
91.851
-5.698
-5.84%
1 jan 1981 ano
86.011
-5.841
-6.36%
1 jan 1982 ano
82.642
-3.368
-3.92%
1 jan 1983 ano
83.393
+0.75
0.91%
1 jan 1984 ano
81.993
-1.4
-1.68%
1 jan 1985 ano
82.315
+0.322
0.39%
1 jan 1986 ano
83.667
+1.351
1.64%
1 jan 1987 ano
82.74
-0.927
-1.11%
1 jan 1988 ano
82.002
-0.738
-0.89%
1 jan 1989 ano
81.367
-0.635
-0.77%
1 jan 1990 ano
83.712
+2.346
2.88%
1 jan 1991 ano
83.748
+0.036
0.04%
1 jan 1992 ano
88.866
+5.118
6.11%
1 jan 1993 ano
95.883
+7.016
7.9%
1 jan 1994 ano
96.816
+0.933
0.97%
1 jan 1995 ano
94.647
-2.169
-2.24%
1 jan 1996 ano
89.607
-5.04
-5.32%
1 jan 1997 ano
87.663
-1.945
-2.17%
1 jan 1998 ano
85.848
-1.814
-2.07%
1 jan 1999 ano
86.516
+0.668
0.78%
1 jan 2002 ano
93.945
+7.429
8.59%
1 jan 2003 ano
93.532
-0.413
-0.44%
1 jan 2004 ano
99.247
+5.715
6.11%
1 jan 2005 ano
100.328
+1.081
1.09%
1 jan 2006 ano
104.72
+4.392
4.38%
1 jan 2007 ano
108.618
+3.898
3.72%
1 jan 2008 ano
124.82
+16.202
14.92%
1 jan 2009 ano
137.613
+12.793
10.25%
1 jan 2010 ano
146.289
+8.676
6.3%
1 jan 2011 ano
160.458
+14.169
9.69%
1 jan 2012 ano
164.12
+3.663
2.28%
1 jan 2013 ano
177.392
+13.271
8.09%
1 jan 2014 ano
172.715
-4.676
-2.64%
1 jan 2015 ano
172.301
-0.414
-0.24%
1 jan 2016 ano
170.73
-1.571
-0.91%
Classificação de países por estatísticas atuais por anos


Comentários: