29
/pt/
pt
AIzaSyAYiBZKx7MnpbEhh9jyipgxe19OcubqV5w
April 1, 2024
194075
Mauritius
MUS
true
2
1
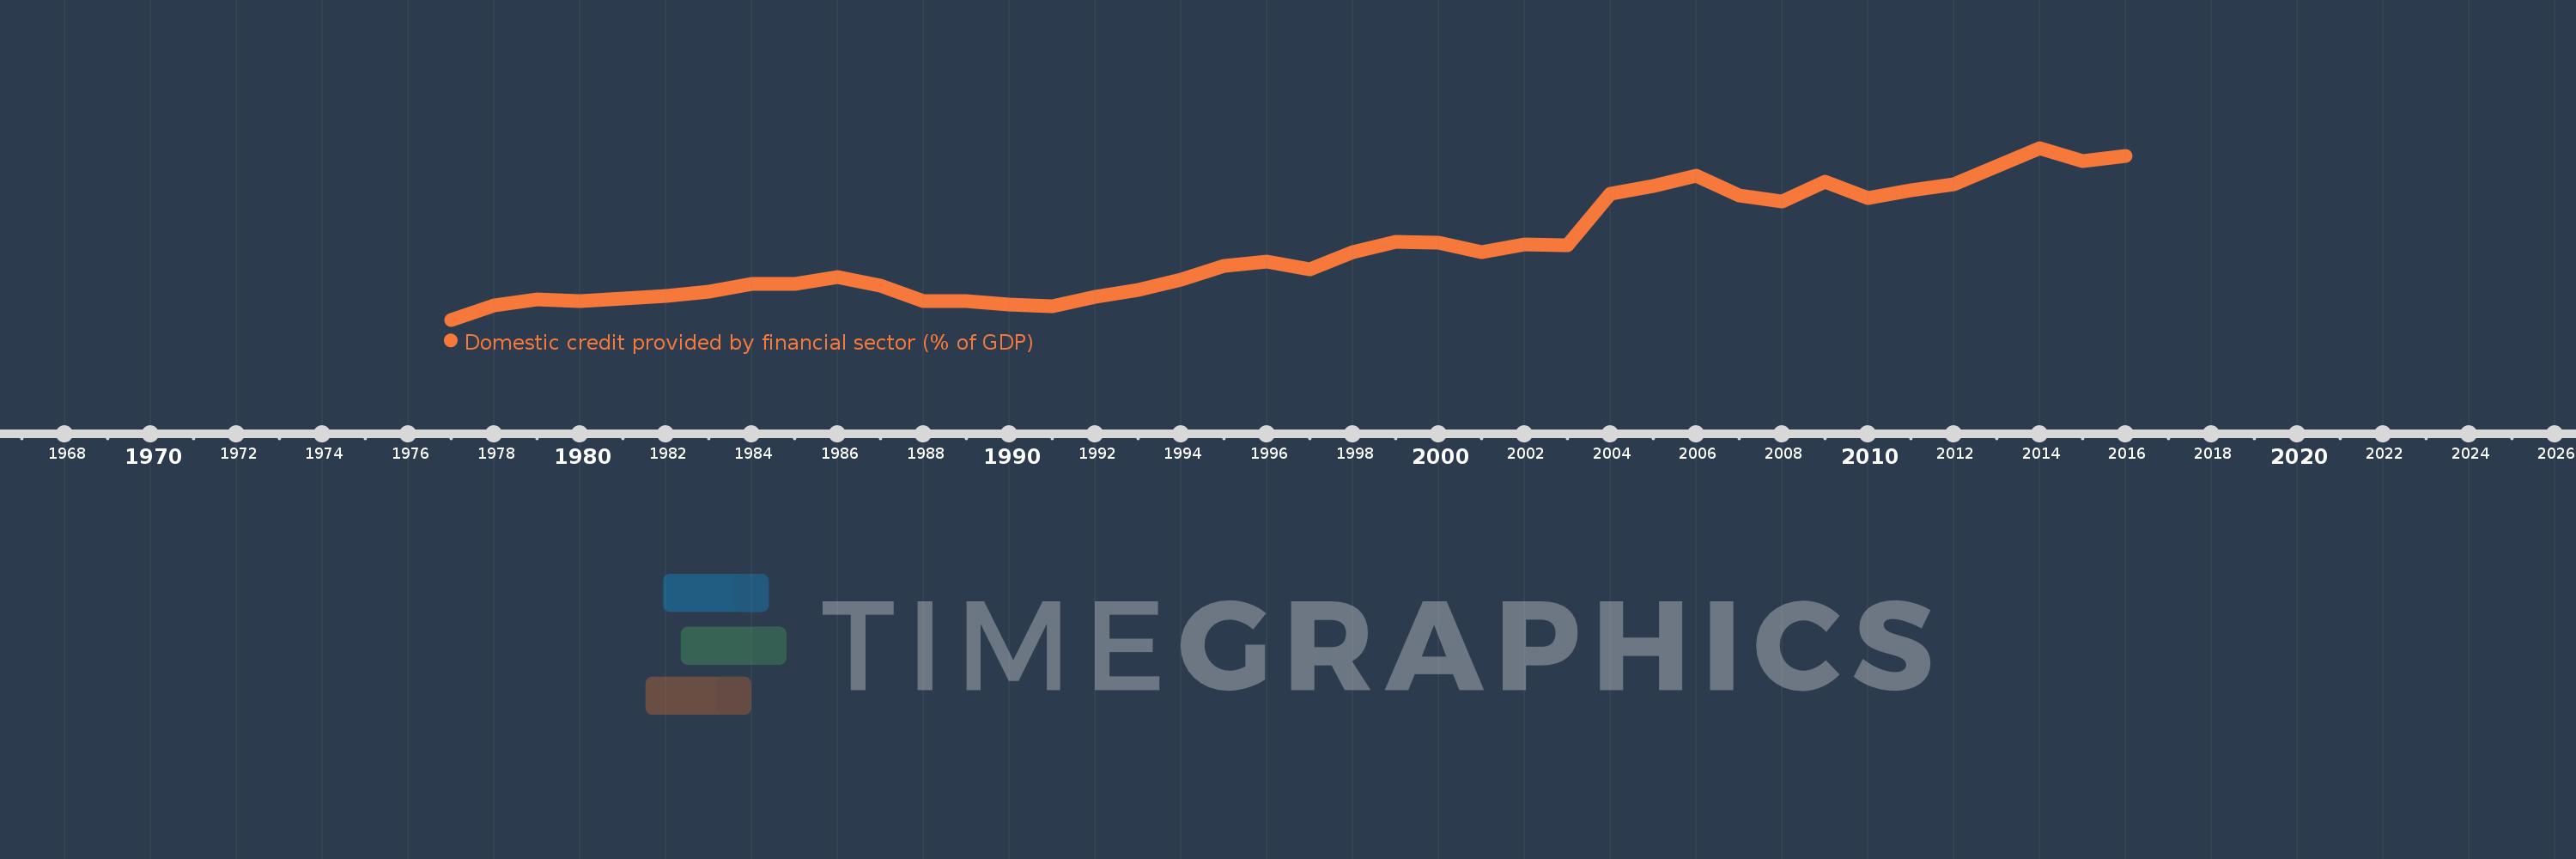
Domestic credit provided by financial sector (% of GDP)
2016,2015,2014,2013,2012,2011,2010,2009,2008,2007,2006,2005,2004,2003,2002,2001,2000,1999,1998,1997,1996,1995,1994,1993,1992,1991,1990,1989,1988,1987,1986,1985,1984,1983,1982,1981,1980,1979,1978,1977
Estas estatísticas em outros países:
AfghanistanAlbaniaAlgeriaAngolaAntigua and BarbudaArab WorldArgentinaArmeniaArubaAustraliaAustriaAzerbaijanBahamas, TheBahrainBangladeshBarbadosBelarusBelgiumBelizeBeninBhutanBoliviaBosnia and HerzegovinaBotswanaBrazilBrunei DarussalamBulgariaBurkina FasoBurundiCabo VerdeCambodiaCameroonCanadaCaribbean small statesCentral African RepublicCentral Europe and the BalticsChadChileChinaColombiaComorosCongo, Dem. Rep.Congo, Rep.Costa RicaCote d'IvoireCroatiaCyprusCzech RepublicDenmarkDjiboutiDominicaDominican RepublicEarly-demographic dividendEast Asia & PacificEast Asia & Pacific (excluding high income)East Asia & Pacific (IDA & IBRD countries)EcuadorEgypt, Arab Rep.El SalvadorEquatorial GuineaEritreaEstoniaEthiopiaEuro areaEurope & Central AsiaEurope & Central Asia (excluding high income)Europe & Central Asia (IDA & IBRD countries)European UnionFijiFinlandFragile and conflict affected situationsFranceGabonGambia, TheGeorgiaGermanyGhanaGreeceGrenadaGuatemalaGuineaGuinea-BissauGuyanaHaitiHeavily indebted poor countries (HIPC)High incomeHondurasHong Kong SAR, ChinaHungaryIBRD onlyIcelandIDA & IBRD totalIDA blendIDA onlyIDA totalIndiaIndonesiaIran, Islamic Rep.IraqIrelandIsraelItalyJamaicaJapanJordanKazakhstanKenyaKorea, Rep.KosovoKuwaitKyrgyz RepublicLao PDRLate-demographic dividendLatin America & Caribbean Latin America & Caribbean (excluding high income)Latin America & the Caribbean (IDA & IBRD countries)LatviaLeast developed countries: UN classificationLebanonLesothoLiberiaLibyaLithuaniaLow & middle incomeLow incomeLower middle incomeLuxembourgMacao SAR, ChinaMacedonia, FYRMadagascarMalawiMalaysiaMaldivesMaliMaltaMauritaniaMauritiusMexicoMicronesia, Fed. Sts.Middle East & North AfricaMiddle East & North Africa (excluding high income)Middle East & North Africa (IDA & IBRD countries)Middle incomeMoldovaMongoliaMontenegroMoroccoMozambiqueMyanmarNamibiaNepalNetherlandsNew ZealandNicaraguaNigerNigeriaNorth AmericaNorwayOECD membersOmanOther small statesPacific island small statesPakistanPanamaPapua New GuineaParaguayPeruPhilippinesPolandPortugalPost-demographic dividendPre-demographic dividendQatarRomaniaRussian FederationRwandaSamoaSao Tome and PrincipeSaudi ArabiaSenegalSerbiaSeychellesSierra LeoneSingaporeSlovak RepublicSloveniaSmall statesSolomon IslandsSouth AfricaSouth AsiaSouth Asia (IDA & IBRD)South SudanSpainSri LankaSt. Kitts and NevisSt. LuciaSt. Vincent and the GrenadinesSub-Saharan Africa Sub-Saharan Africa (excluding high income)Sub-Saharan Africa (IDA & IBRD countries)SudanSurinameSwazilandSwedenSwitzerlandSyrian Arab RepublicTajikistanTanzaniaThailandTimor-LesteTogoTongaTrinidad and TobagoTunisiaTurkeyUgandaUkraineUnited Arab EmiratesUnited KingdomUnited StatesUpper middle incomeUruguayVanuatuVenezuela, RBVietnamWest Bank and GazaWorldYemen, Rep.ZambiaZimbabwe Linha do tempo:
Nesta escala de tempo está apresentado um gráfico de 1977 ano até 2016 ano Mauritius. Dados de 1976 ano ausente. O número de observações reais por data: 40.
Fonte (nome):
Indicadores de desenvolvimento mundial
Fonte (organização):
International Monetary Fund, International Financial Statistics and data files, and World Bank and OECD GDP estimates.
Categorias:
Financial Sector
Foi atualizado:
23 abr 2017 ano
Indicadores de alterações dos valores ao longo dos anos
Mínimo:
38.429
1 jan 1977 ano
Máximo:
120.349
1 jan 2014 ano
Na data de observação
Valor
Mudança absoluta
A alteração em relação ao valor anterior
1 jan 1977 ano
38.429
+38.429
0.0%
1 jan 1978 ano
45.253
+6.824
17.76%
1 jan 1979 ano
48.122
+2.869
6.34%
1 jan 1980 ano
47.447
-0.674
-1.4%
1 jan 1981 ano
48.494
+1.046
2.21%
1 jan 1982 ano
49.64
+1.146
2.36%
1 jan 1983 ano
51.906
+2.267
4.57%
1 jan 1984 ano
55.526
+3.62
6.97%
1 jan 1985 ano
55.662
+0.135
0.24%
1 jan 1986 ano
58.941
+3.279
5.89%
1 jan 1987 ano
54.572
-4.369
-7.41%
1 jan 1988 ano
47.36
-7.212
-13.21%
1 jan 1989 ano
47.135
-0.225
-0.48%
1 jan 1990 ano
45.657
-1.478
-3.14%
1 jan 1991 ano
44.687
-0.97
-2.12%
1 jan 1992 ano
49.429
+4.742
10.61%
1 jan 1993 ano
52.557
+3.128
6.33%
1 jan 1994 ano
57.556
+4.999
9.51%
1 jan 1995 ano
63.989
+6.433
11.18%
1 jan 1996 ano
66.147
+2.157
3.37%
1 jan 1997 ano
62.282
-3.865
-5.84%
1 jan 1998 ano
70.764
+8.482
13.62%
1 jan 1999 ano
75.631
+4.867
6.88%
1 jan 2000 ano
75.241
-0.39
-0.52%
1 jan 2001 ano
70.783
-4.457
-5.92%
1 jan 2002 ano
74.422
+3.638
5.14%
1 jan 2003 ano
74.112
-0.309
-0.42%
1 jan 2004 ano
98.316
+24.203
32.66%
1 jan 2005 ano
102.24
+3.924
3.99%
1 jan 2006 ano
107.2
+4.96
4.85%
1 jan 2007 ano
97.818
-9.381
-8.75%
1 jan 2008 ano
94.898
-2.92
-2.99%
1 jan 2009 ano
104.167
+9.269
9.77%
1 jan 2010 ano
96.489
-7.677
-7.37%
1 jan 2011 ano
100.292
+3.802
3.94%
1 jan 2012 ano
103.222
+2.931
2.92%
1 jan 2013 ano
111.515
+8.293
8.03%
1 jan 2014 ano
120.349
+8.833
7.92%
1 jan 2015 ano
113.963
-6.385
-5.31%
1 jan 2016 ano
116.392
+2.429
2.13%
Classificação de países por estatísticas atuais por anos


Comentários: