29
/pt/
pt
AIzaSyAYiBZKx7MnpbEhh9jyipgxe19OcubqV5w
April 1, 2024
72788
Australia
AUS
true
2
1
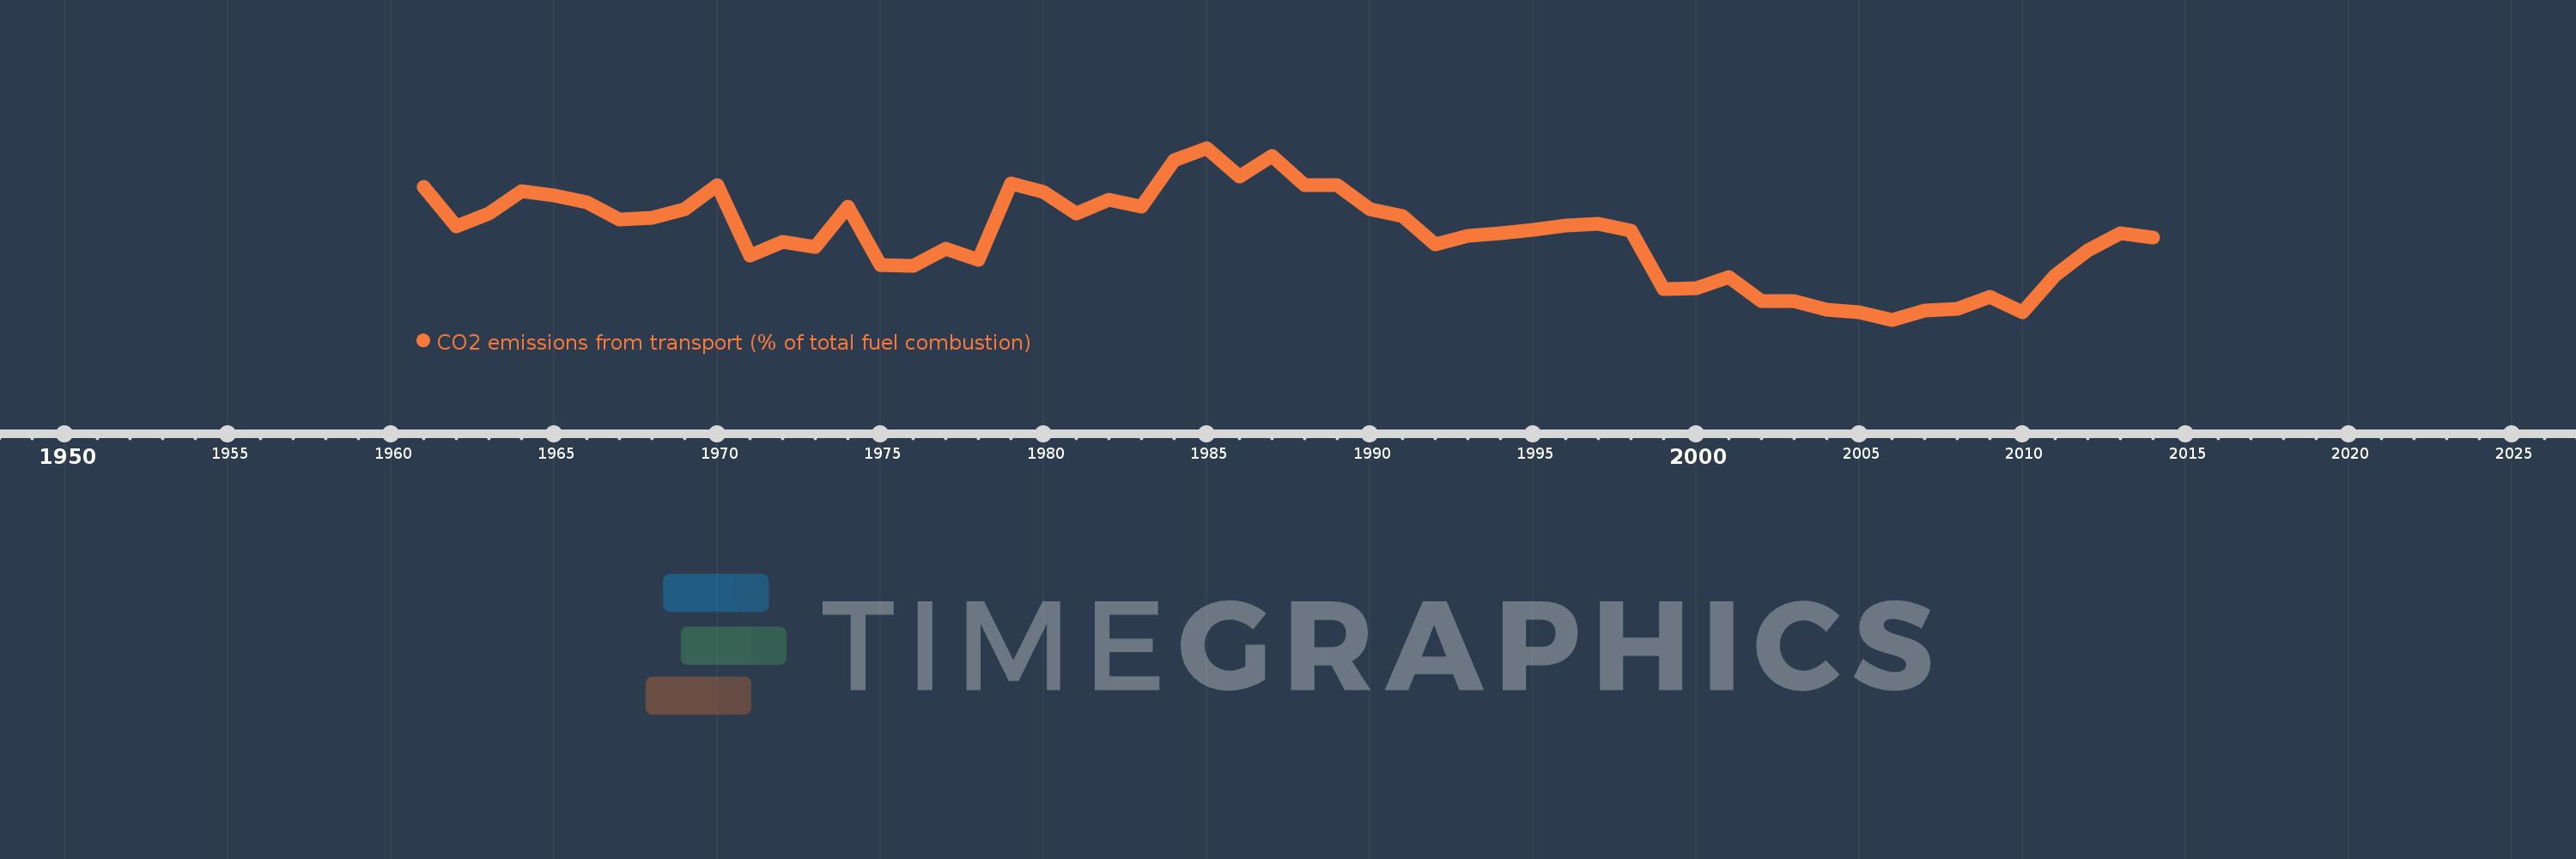
CO2 emissions from transport (% of total fuel combustion)
2014,2013,2012,2011,2010,2009,2008,2007,2006,2005,2004,2003,2002,2001,2000,1999,1998,1997,1996,1995,1994,1993,1992,1991,1990,1989,1988,1987,1986,1985,1984,1983,1982,1981,1980,1979,1978,1977,1976,1975,1974,1973,1972,1971,1970,1969,1968,1967,1966,1965,1964,1963,1962,1961
Estas estatísticas em outros países:
AlbaniaAlgeriaAngolaArab WorldArgentinaArmeniaAustraliaAustriaAzerbaijanBahrainBangladeshBelarusBelgiumBeninBoliviaBosnia and HerzegovinaBotswanaBrazilBrunei DarussalamBulgariaCambodiaCameroonCanadaCaribbean small statesCentral Europe and the BalticsChileChinaColombiaCongo, Dem. Rep.Congo, Rep.Costa RicaCote d'IvoireCroatiaCubaCuracaoCyprusCzech RepublicDenmarkDominican RepublicEarly-demographic dividendEast Asia & PacificEast Asia & Pacific (excluding high income)East Asia & Pacific (IDA & IBRD countries)EcuadorEgypt, Arab Rep.El SalvadorEritreaEstoniaEthiopiaEuro areaEurope & Central AsiaEurope & Central Asia (excluding high income)Europe & Central Asia (IDA & IBRD countries)European UnionFinlandFragile and conflict affected situationsFranceGabonGeorgiaGermanyGhanaGibraltarGreeceGuatemalaHaitiHeavily indebted poor countries (HIPC)High incomeHondurasHong Kong SAR, ChinaHungaryIBRD onlyIcelandIDA & IBRD totalIDA blendIDA onlyIDA totalIndiaIndonesiaIran, Islamic Rep.IraqIrelandIsraelItalyJamaicaJapanJordanKazakhstanKenyaKorea, Dem. People’s Rep.Korea, Rep.KosovoKuwaitKyrgyz RepublicLate-demographic dividendLatin America & Caribbean Latin America & Caribbean (excluding high income)Latin America & the Caribbean (IDA & IBRD countries)LatviaLeast developed countries: UN classificationLebanonLibyaLithuaniaLow & middle incomeLow incomeLower middle incomeLuxembourgMacedonia, FYRMalaysiaMaltaMauritiusMexicoMiddle East & North AfricaMiddle East & North Africa (excluding high income)Middle East & North Africa (IDA & IBRD countries)Middle incomeMoldovaMongoliaMontenegroMoroccoMozambiqueMyanmarNamibiaNepalNetherlandsNew ZealandNicaraguaNigerNigeriaNorth AmericaNorwayOECD membersOmanOther small statesPakistanPanamaParaguayPeruPhilippinesPolandPortugalPost-demographic dividendPre-demographic dividendQatarRomaniaRussian FederationSaudi ArabiaSenegalSerbiaSingaporeSlovak RepublicSloveniaSmall statesSouth AfricaSouth AsiaSouth Asia (IDA & IBRD)South SudanSpainSri LankaSub-Saharan Africa Sub-Saharan Africa (excluding high income)Sub-Saharan Africa (IDA & IBRD countries)SudanSwedenSwitzerlandSyrian Arab RepublicTajikistanTanzaniaThailandTogoTrinidad and TobagoTunisiaTurkeyTurkmenistanUkraineUnited Arab EmiratesUnited KingdomUnited StatesUpper middle incomeUruguayUzbekistanVenezuela, RBVietnamWorldYemen, Rep.ZambiaZimbabwe Linha do tempo:
Nesta escala de tempo está apresentado um gráfico de 1961 ano até 2014 ano Australia. Dados de 1960 ano ausente. O número de observações reais por data: 54.
Fonte (nome):
Indicadores de desenvolvimento mundial
Fonte (organização):
IEA Statistics © OECD/IEA 2014 (http://www.iea.org/stats/index.asp), subject to https://www.iea.org/t&c/termsandconditions/
Categorias:
Environment
Foi atualizado:
23 abr 2017 ano
Indicadores de alterações dos valores ao longo dos anos
Mínimo:
21.356
1 jan 2006 ano
Máximo:
25.579
1 jan 1985 ano
Na data de observação
Valor
Mudança absoluta
A alteração em relação ao valor anterior
1 jan 1961 ano
24.613
+24.613
0.0%
1 jan 1962 ano
23.65
-0.962
-3.91%
1 jan 1963 ano
23.976
+0.326
1.38%
1 jan 1964 ano
24.513
+0.537
2.24%
1 jan 1965 ano
24.42
-0.093
-0.38%
1 jan 1966 ano
24.241
-0.179
-0.73%
1 jan 1967 ano
23.821
-0.42
-1.73%
1 jan 1968 ano
23.854
+0.033
0.14%
1 jan 1969 ano
24.082
+0.228
0.96%
1 jan 1970 ano
24.672
+0.59
2.45%
1 jan 1971 ano
22.933
-1.739
-7.05%
1 jan 1972 ano
23.277
+0.344
1.5%
1 jan 1973 ano
23.139
-0.138
-0.59%
1 jan 1974 ano
24.138
+0.999
4.32%
1 jan 1975 ano
22.698
-1.44
-5.97%
1 jan 1976 ano
22.686
-0.012
-0.05%
1 jan 1977 ano
23.103
+0.417
1.84%
1 jan 1978 ano
22.837
-0.266
-1.15%
1 jan 1979 ano
24.706
+1.869
8.18%
1 jan 1980 ano
24.486
-0.22
-0.89%
1 jan 1981 ano
23.977
-0.509
-2.08%
1 jan 1982 ano
24.314
+0.337
1.41%
1 jan 1983 ano
24.133
-0.181
-0.74%
1 jan 1984 ano
25.285
+1.152
4.77%
1 jan 1985 ano
25.579
+0.294
1.16%
1 jan 1986 ano
24.878
-0.701
-2.74%
1 jan 1987 ano
25.384
+0.505
2.03%
1 jan 1988 ano
24.664
-0.72
-2.84%
1 jan 1989 ano
24.656
-0.007
-0.03%
1 jan 1990 ano
24.069
-0.587
-2.38%
1 jan 1991 ano
23.895
-0.174
-0.72%
1 jan 1992 ano
23.206
-0.689
-2.88%
1 jan 1993 ano
23.416
+0.209
0.9%
1 jan 1994 ano
23.488
+0.072
0.31%
1 jan 1995 ano
23.576
+0.088
0.38%
1 jan 1996 ano
23.667
+0.09
0.38%
1 jan 1997 ano
23.712
+0.046
0.19%
1 jan 1998 ano
23.544
-0.168
-0.71%
1 jan 1999 ano
22.116
-1.429
-6.07%
1 jan 2000 ano
22.125
+0.009
0.04%
1 jan 2001 ano
22.408
+0.283
1.28%
1 jan 2002 ano
21.816
-0.592
-2.64%
1 jan 2003 ano
21.818
+0.002
0.01%
1 jan 2004 ano
21.611
-0.207
-0.95%
1 jan 2005 ano
21.549
-0.062
-0.29%
1 jan 2006 ano
21.356
-0.192
-0.89%
1 jan 2007 ano
21.585
+0.229
1.07%
1 jan 2008 ano
21.634
+0.048
0.22%
1 jan 2009 ano
21.928
+0.294
1.36%
1 jan 2010 ano
21.545
-0.383
-1.75%
1 jan 2011 ano
22.441
+0.896
4.16%
1 jan 2012 ano
23.062
+0.62
2.76%
1 jan 2013 ano
23.472
+0.411
1.78%
1 jan 2014 ano
23.377
-0.096
-0.41%
Classificação de países por estatísticas atuais por anos


Comentários: