29
/pt/
pt
AIzaSyAYiBZKx7MnpbEhh9jyipgxe19OcubqV5w
April 1, 2024
193986
Mauritius
MUS
true
2
1
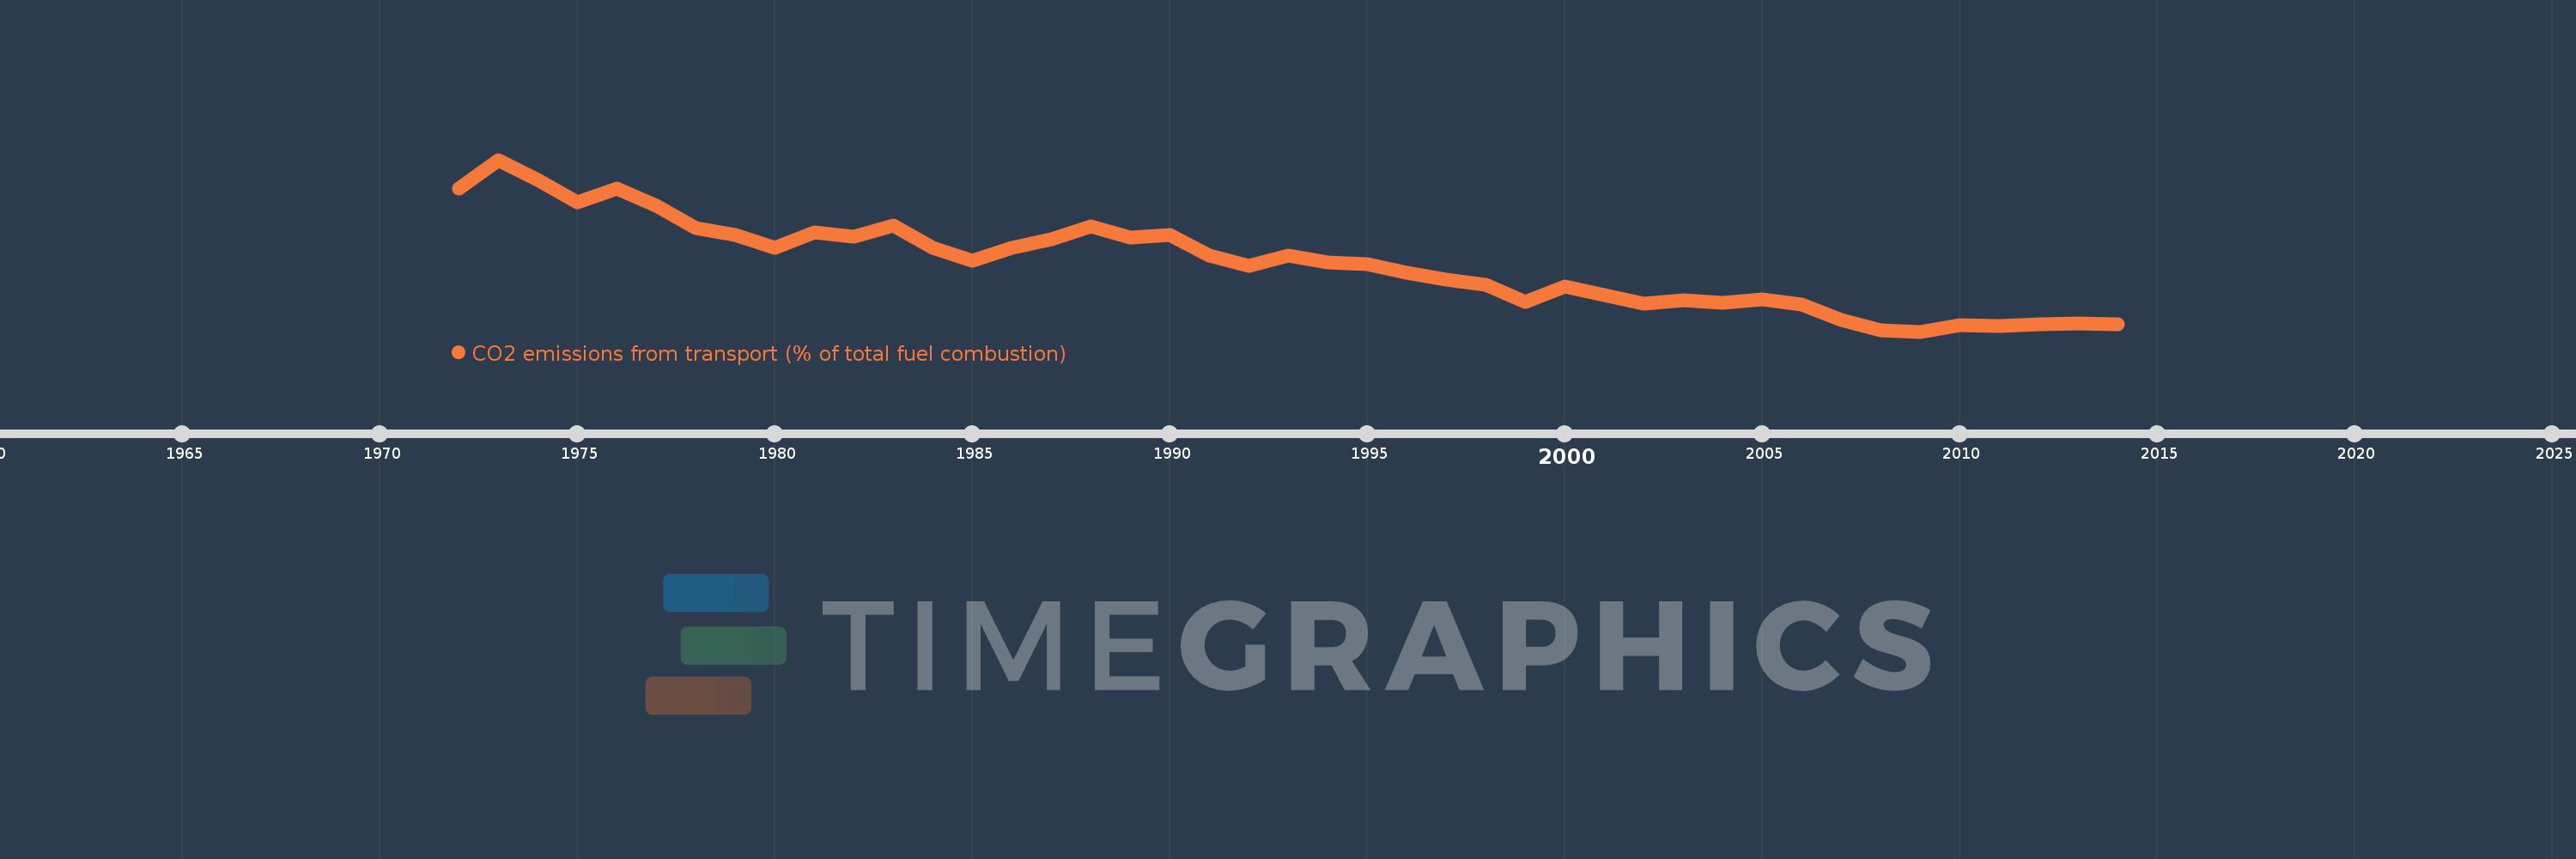
CO2 emissions from transport (% of total fuel combustion)
2014,2013,2012,2011,2010,2009,2008,2007,2006,2005,2004,2003,2002,2001,2000,1999,1998,1997,1996,1995,1994,1993,1992,1991,1990,1989,1988,1987,1986,1985,1984,1983,1982,1981,1980,1979,1978,1977,1976,1975,1974,1973,1972
Estas estatísticas em outros países:
AlbaniaAlgeriaAngolaArab WorldArgentinaArmeniaAustraliaAustriaAzerbaijanBahrainBangladeshBelarusBelgiumBeninBoliviaBosnia and HerzegovinaBotswanaBrazilBrunei DarussalamBulgariaCambodiaCameroonCanadaCaribbean small statesCentral Europe and the BalticsChileChinaColombiaCongo, Dem. Rep.Congo, Rep.Costa RicaCote d'IvoireCroatiaCubaCuracaoCyprusCzech RepublicDenmarkDominican RepublicEarly-demographic dividendEast Asia & PacificEast Asia & Pacific (excluding high income)East Asia & Pacific (IDA & IBRD countries)EcuadorEgypt, Arab Rep.El SalvadorEritreaEstoniaEthiopiaEuro areaEurope & Central AsiaEurope & Central Asia (excluding high income)Europe & Central Asia (IDA & IBRD countries)European UnionFinlandFragile and conflict affected situationsFranceGabonGeorgiaGermanyGhanaGibraltarGreeceGuatemalaHaitiHeavily indebted poor countries (HIPC)High incomeHondurasHong Kong SAR, ChinaHungaryIBRD onlyIcelandIDA & IBRD totalIDA blendIDA onlyIDA totalIndiaIndonesiaIran, Islamic Rep.IraqIrelandIsraelItalyJamaicaJapanJordanKazakhstanKenyaKorea, Dem. People’s Rep.Korea, Rep.KosovoKuwaitKyrgyz RepublicLate-demographic dividendLatin America & Caribbean Latin America & Caribbean (excluding high income)Latin America & the Caribbean (IDA & IBRD countries)LatviaLeast developed countries: UN classificationLebanonLibyaLithuaniaLow & middle incomeLow incomeLower middle incomeLuxembourgMacedonia, FYRMalaysiaMaltaMauritiusMexicoMiddle East & North AfricaMiddle East & North Africa (excluding high income)Middle East & North Africa (IDA & IBRD countries)Middle incomeMoldovaMongoliaMontenegroMoroccoMozambiqueMyanmarNamibiaNepalNetherlandsNew ZealandNicaraguaNigerNigeriaNorth AmericaNorwayOECD membersOmanOther small statesPakistanPanamaParaguayPeruPhilippinesPolandPortugalPost-demographic dividendPre-demographic dividendQatarRomaniaRussian FederationSaudi ArabiaSenegalSerbiaSingaporeSlovak RepublicSloveniaSmall statesSouth AfricaSouth AsiaSouth Asia (IDA & IBRD)South SudanSpainSri LankaSub-Saharan Africa Sub-Saharan Africa (excluding high income)Sub-Saharan Africa (IDA & IBRD countries)SudanSwedenSwitzerlandSyrian Arab RepublicTajikistanTanzaniaThailandTogoTrinidad and TobagoTunisiaTurkeyTurkmenistanUkraineUnited Arab EmiratesUnited KingdomUnited StatesUpper middle incomeUruguayUzbekistanVenezuela, RBVietnamWorldYemen, Rep.ZambiaZimbabwe Linha do tempo:
Nesta escala de tempo está apresentado um gráfico de 1972 ano até 2014 ano Mauritius. Dados de 1971 ano ausente. O número de observações reais por data: 43.
Fonte (nome):
Indicadores de desenvolvimento mundial
Fonte (organização):
IEA Statistics © OECD/IEA 2014 (http://www.iea.org/stats/index.asp), subject to https://www.iea.org/t&c/termsandconditions/
Categorias:
Environment
Foi atualizado:
23 abr 2017 ano
Indicadores de alterações dos valores ao longo dos anos
Mínimo:
24.207
1 jan 2009 ano
Máximo:
55.172
1 jan 1973 ano
Na data de observação
Valor
Mudança absoluta
A alteração em relação ao valor anterior
1 jan 1972 ano
50.0
+50.0
0.0%
1 jan 1973 ano
55.172
+5.172
10.34%
1 jan 1974 ano
51.515
-3.657
-6.63%
1 jan 1975 ano
47.5
-4.015
-7.79%
1 jan 1976 ano
50.0
+2.5
5.26%
1 jan 1977 ano
46.939
-3.061
-6.12%
1 jan 1978 ano
42.857
-4.082
-8.7%
1 jan 1979 ano
41.667
-1.19
-2.78%
1 jan 1980 ano
39.344
-2.322
-5.57%
1 jan 1981 ano
42.105
+2.761
7.02%
1 jan 1982 ano
41.379
-0.726
-1.72%
1 jan 1983 ano
43.396
+2.017
4.87%
1 jan 1984 ano
39.344
-4.052
-9.34%
1 jan 1985 ano
36.923
-2.421
-6.15%
1 jan 1986 ano
39.344
+2.421
6.56%
1 jan 1987 ano
40.789
+1.445
3.67%
1 jan 1988 ano
43.21
+2.42
5.93%
1 jan 1989 ano
41.111
-2.099
-4.86%
1 jan 1990 ano
41.584
+0.473
1.15%
1 jan 1991 ano
37.931
-3.653
-8.78%
1 jan 1992 ano
36.0
-1.931
-5.09%
1 jan 1993 ano
37.879
+1.879
5.22%
1 jan 1994 ano
36.735
-1.144
-3.02%
1 jan 1995 ano
36.424
-0.311
-0.85%
1 jan 1996 ano
34.839
-1.585
-4.35%
1 jan 1997 ano
33.54
-1.298
-3.73%
1 jan 1998 ano
32.716
-0.824
-2.46%
1 jan 1999 ano
29.609
-3.107
-9.5%
1 jan 2000 ano
32.273
+2.664
9.0%
1 jan 2001 ano
30.864
-1.409
-4.36%
1 jan 2002 ano
29.297
-1.567
-5.08%
1 jan 2003 ano
29.885
+0.588
2.01%
1 jan 2004 ano
29.455
-0.431
-1.44%
1 jan 2005 ano
29.964
+0.509
1.73%
1 jan 2006 ano
29.054
-0.91
-3.04%
1 jan 2007 ano
26.364
-2.69
-9.26%
1 jan 2008 ano
24.484
-1.88
-7.13%
1 jan 2009 ano
24.207
-0.276
-1.13%
1 jan 2010 ano
25.439
+1.231
5.09%
1 jan 2011 ano
25.137
-0.302
-1.19%
1 jan 2012 ano
25.549
+0.413
1.64%
1 jan 2013 ano
25.737
+0.188
0.74%
1 jan 2014 ano
25.587
-0.15
-0.58%
Classificação de países por estatísticas atuais por anos


Comentários: