29
/pt/
pt
AIzaSyAYiBZKx7MnpbEhh9jyipgxe19OcubqV5w
April 1, 2024
26359
Early-demographic dividend
EAR
false
2
1
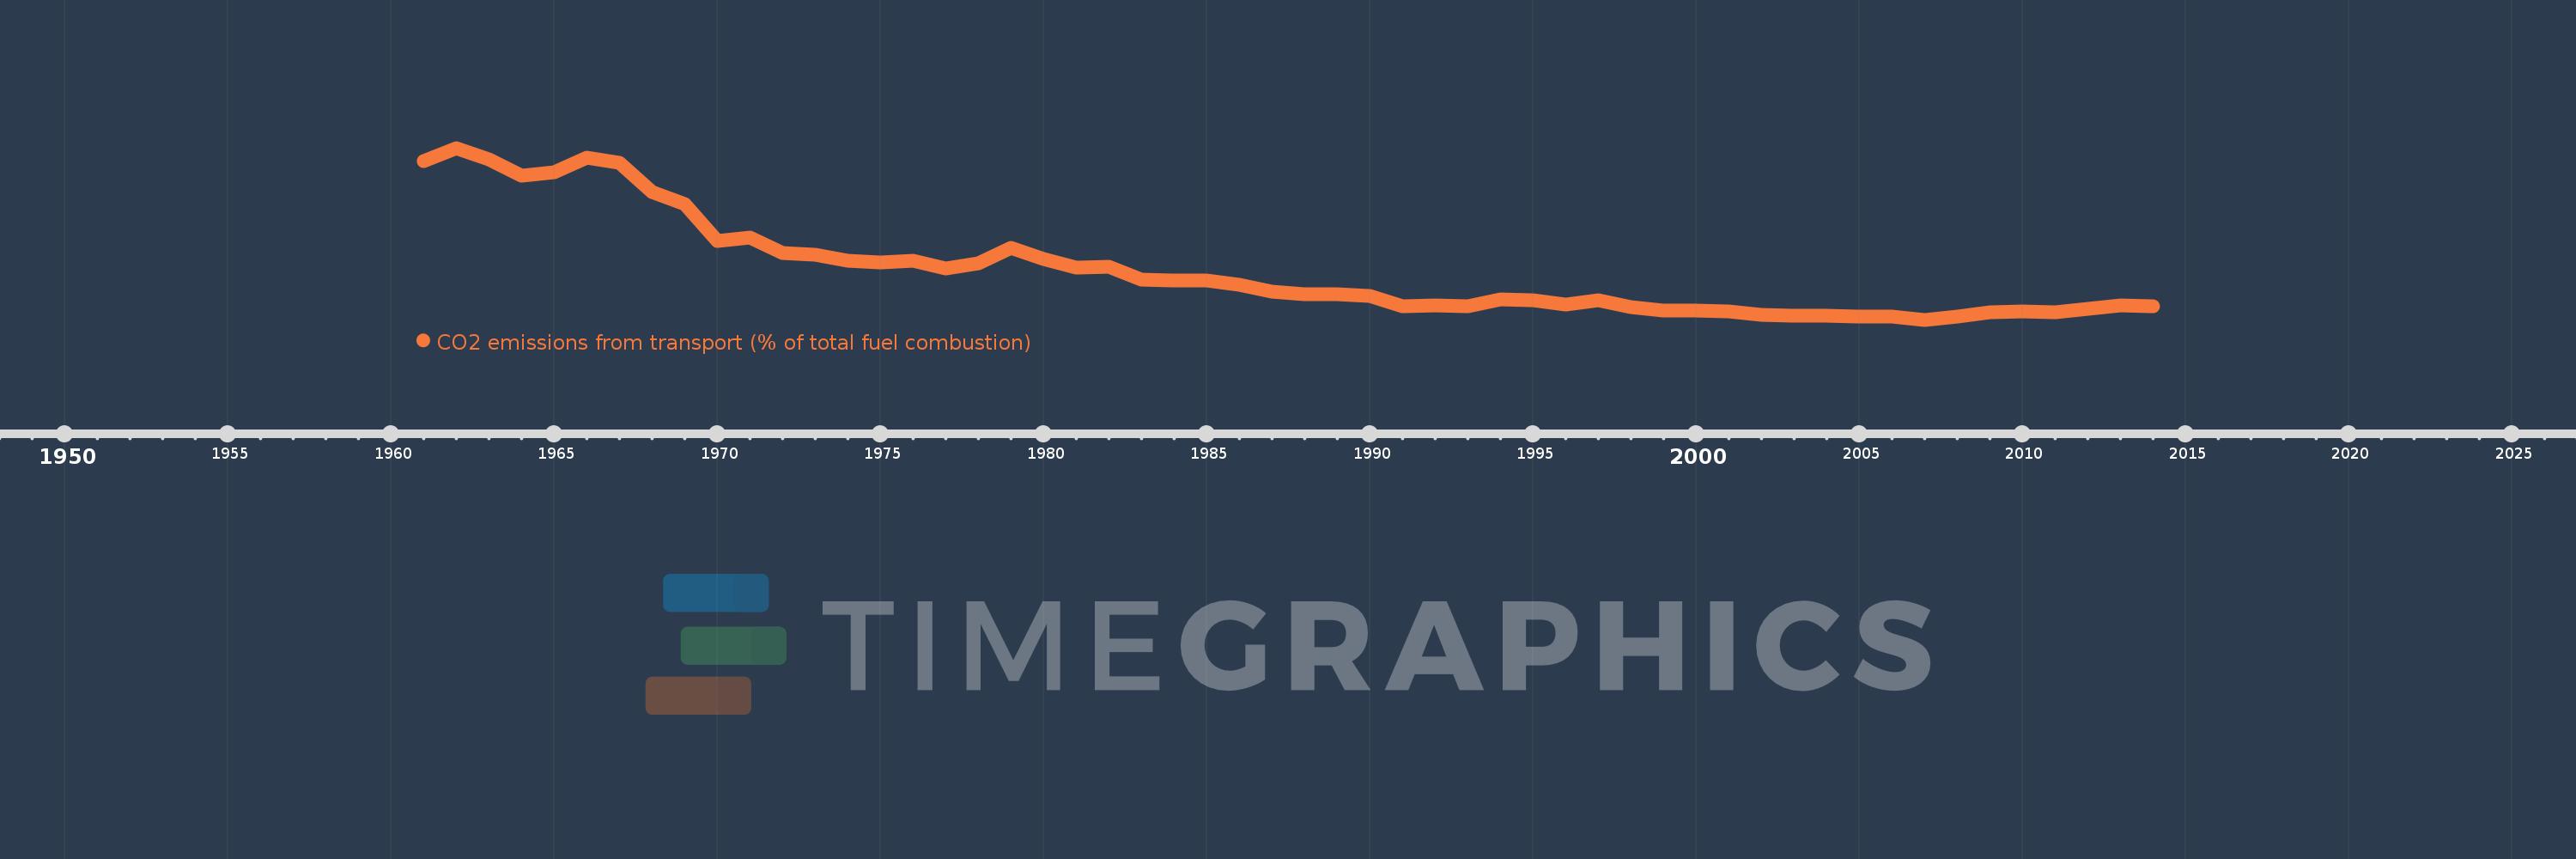
CO2 emissions from transport (% of total fuel combustion)
2014,2013,2012,2011,2010,2009,2008,2007,2006,2005,2004,2003,2002,2001,2000,1999,1998,1997,1996,1995,1994,1993,1992,1991,1990,1989,1988,1987,1986,1985,1984,1983,1982,1981,1980,1979,1978,1977,1976,1975,1974,1973,1972,1971,1970,1969,1968,1967,1966,1965,1964,1963,1962,1961
Estas estatísticas em outros países:
AlbaniaAlgeriaAngolaArab WorldArgentinaArmeniaAustraliaAustriaAzerbaijanBahrainBangladeshBelarusBelgiumBeninBoliviaBosnia and HerzegovinaBotswanaBrazilBrunei DarussalamBulgariaCambodiaCameroonCanadaCaribbean small statesCentral Europe and the BalticsChileChinaColombiaCongo, Dem. Rep.Congo, Rep.Costa RicaCote d'IvoireCroatiaCubaCuracaoCyprusCzech RepublicDenmarkDominican RepublicEarly-demographic dividendEast Asia & PacificEast Asia & Pacific (excluding high income)East Asia & Pacific (IDA & IBRD countries)EcuadorEgypt, Arab Rep.El SalvadorEritreaEstoniaEthiopiaEuro areaEurope & Central AsiaEurope & Central Asia (excluding high income)Europe & Central Asia (IDA & IBRD countries)European UnionFinlandFragile and conflict affected situationsFranceGabonGeorgiaGermanyGhanaGibraltarGreeceGuatemalaHaitiHeavily indebted poor countries (HIPC)High incomeHondurasHong Kong SAR, ChinaHungaryIBRD onlyIcelandIDA & IBRD totalIDA blendIDA onlyIDA totalIndiaIndonesiaIran, Islamic Rep.IraqIrelandIsraelItalyJamaicaJapanJordanKazakhstanKenyaKorea, Dem. People’s Rep.Korea, Rep.KosovoKuwaitKyrgyz RepublicLate-demographic dividendLatin America & Caribbean Latin America & Caribbean (excluding high income)Latin America & the Caribbean (IDA & IBRD countries)LatviaLeast developed countries: UN classificationLebanonLibyaLithuaniaLow & middle incomeLow incomeLower middle incomeLuxembourgMacedonia, FYRMalaysiaMaltaMauritiusMexicoMiddle East & North AfricaMiddle East & North Africa (excluding high income)Middle East & North Africa (IDA & IBRD countries)Middle incomeMoldovaMongoliaMontenegroMoroccoMozambiqueMyanmarNamibiaNepalNetherlandsNew ZealandNicaraguaNigerNigeriaNorth AmericaNorwayOECD membersOmanOther small statesPakistanPanamaParaguayPeruPhilippinesPolandPortugalPost-demographic dividendPre-demographic dividendQatarRomaniaRussian FederationSaudi ArabiaSenegalSerbiaSingaporeSlovak RepublicSloveniaSmall statesSouth AfricaSouth AsiaSouth Asia (IDA & IBRD)South SudanSpainSri LankaSub-Saharan Africa Sub-Saharan Africa (excluding high income)Sub-Saharan Africa (IDA & IBRD countries)SudanSwedenSwitzerlandSyrian Arab RepublicTajikistanTanzaniaThailandTogoTrinidad and TobagoTunisiaTurkeyTurkmenistanUkraineUnited Arab EmiratesUnited KingdomUnited StatesUpper middle incomeUruguayUzbekistanVenezuela, RBVietnamWorldYemen, Rep.ZambiaZimbabwe Linha do tempo:
Nesta escala de tempo está apresentado um gráfico de 1961 ano até 2014 ano Early-demographic dividend. Dados de 1960 ano ausente. O número de observações reais por data: 54.
Fonte (nome):
Indicadores de desenvolvimento mundial
Fonte (organização):
IEA Statistics © OECD/IEA 2014 (http://www.iea.org/stats/index.asp), subject to https://www.iea.org/t&c/termsandconditions/
Categorias:
Environment
Foi atualizado:
23 abr 2017 ano
Indicadores de alterações dos valores ao longo dos anos
Mínimo:
20.565
1 jan 2007 ano
Máximo:
33.943
1 jan 1962 ano
Na data de observação
Valor
Mudança absoluta
A alteração em relação ao valor anterior
1 jan 1961 ano
32.916
+32.916
0.0%
1 jan 1962 ano
33.943
+1.027
3.12%
1 jan 1963 ano
33.028
-0.915
-2.7%
1 jan 1964 ano
31.789
-1.238
-3.75%
1 jan 1965 ano
32.059
+0.27
0.85%
1 jan 1966 ano
33.192
+1.133
3.53%
1 jan 1967 ano
32.807
-0.385
-1.16%
1 jan 1968 ano
30.494
-2.314
-7.05%
1 jan 1969 ano
29.57
-0.923
-3.03%
1 jan 1970 ano
26.682
-2.889
-9.77%
1 jan 1971 ano
26.977
+0.295
1.1%
1 jan 1972 ano
25.767
-1.209
-4.48%
1 jan 1973 ano
25.616
-0.152
-0.59%
1 jan 1974 ano
25.193
-0.423
-1.65%
1 jan 1975 ano
25.021
-0.172
-0.68%
1 jan 1976 ano
25.174
+0.153
0.61%
1 jan 1977 ano
24.566
-0.608
-2.42%
1 jan 1978 ano
24.935
+0.369
1.5%
1 jan 1979 ano
26.16
+1.226
4.92%
1 jan 1980 ano
25.303
-0.857
-3.28%
1 jan 1981 ano
24.633
-0.67
-2.65%
1 jan 1982 ano
24.676
+0.042
0.17%
1 jan 1983 ano
23.659
-1.017
-4.12%
1 jan 1984 ano
23.616
-0.043
-0.18%
1 jan 1985 ano
23.642
+0.027
0.11%
1 jan 1986 ano
23.302
-0.34
-1.44%
1 jan 1987 ano
22.749
-0.553
-2.37%
1 jan 1988 ano
22.582
-0.167
-0.73%
1 jan 1989 ano
22.581
-0.001
-0.01%
1 jan 1990 ano
22.392
-0.188
-0.83%
1 jan 1991 ano
21.584
-0.809
-3.61%
1 jan 1992 ano
21.651
+0.067
0.31%
1 jan 1993 ano
21.62
-0.031
-0.14%
1 jan 1994 ano
22.155
+0.535
2.47%
1 jan 1995 ano
22.067
-0.088
-0.4%
1 jan 1996 ano
21.775
-0.292
-1.32%
1 jan 1997 ano
22.067
+0.292
1.34%
1 jan 1998 ano
21.557
-0.51
-2.31%
1 jan 1999 ano
21.273
-0.284
-1.32%
1 jan 2000 ano
21.262
-0.011
-0.05%
1 jan 2001 ano
21.215
-0.047
-0.22%
1 jan 2002 ano
20.95
-0.265
-1.25%
1 jan 2003 ano
20.896
-0.054
-0.26%
1 jan 2004 ano
20.888
-0.007
-0.03%
1 jan 2005 ano
20.836
-0.052
-0.25%
1 jan 2006 ano
20.842
+0.005
0.02%
1 jan 2007 ano
20.565
-0.277
-1.33%
1 jan 2008 ano
20.837
+0.273
1.33%
1 jan 2009 ano
21.141
+0.304
1.46%
1 jan 2010 ano
21.222
+0.081
0.38%
1 jan 2011 ano
21.177
-0.045
-0.21%
1 jan 2012 ano
21.438
+0.261
1.23%
1 jan 2013 ano
21.663
+0.225
1.05%
1 jan 2014 ano
21.598
-0.065
-0.3%
Classificação de países por estatísticas atuais por anos


Comentários: