29
/pt/
pt
AIzaSyAYiBZKx7MnpbEhh9jyipgxe19OcubqV5w
April 1, 2024
220582
Paraguay
PRY
true
2
1
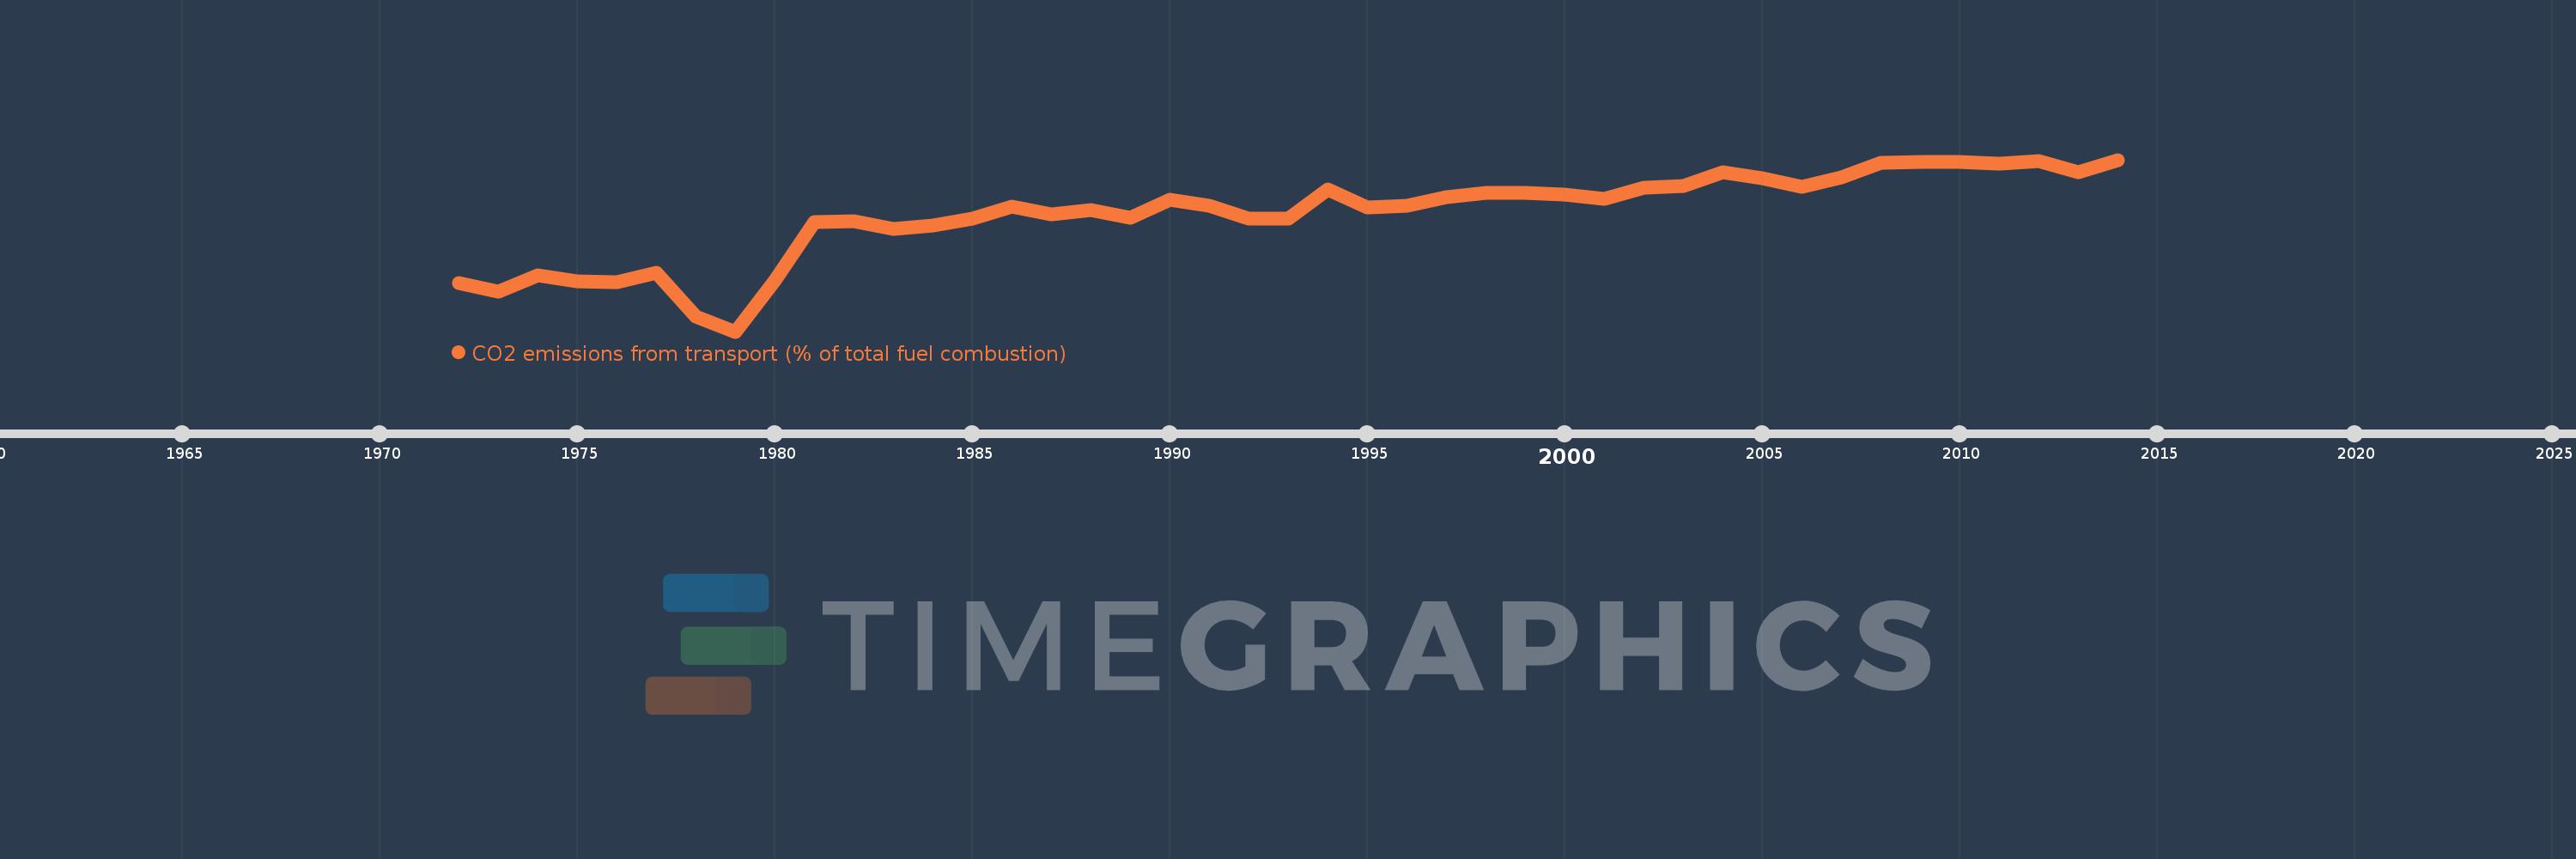
CO2 emissions from transport (% of total fuel combustion)
2014,2013,2012,2011,2010,2009,2008,2007,2006,2005,2004,2003,2002,2001,2000,1999,1998,1997,1996,1995,1994,1993,1992,1991,1990,1989,1988,1987,1986,1985,1984,1983,1982,1981,1980,1979,1978,1977,1976,1975,1974,1973,1972
Estas estatísticas em outros países:
AlbaniaAlgeriaAngolaArab WorldArgentinaArmeniaAustraliaAustriaAzerbaijanBahrainBangladeshBelarusBelgiumBeninBoliviaBosnia and HerzegovinaBotswanaBrazilBrunei DarussalamBulgariaCambodiaCameroonCanadaCaribbean small statesCentral Europe and the BalticsChileChinaColombiaCongo, Dem. Rep.Congo, Rep.Costa RicaCote d'IvoireCroatiaCubaCuracaoCyprusCzech RepublicDenmarkDominican RepublicEarly-demographic dividendEast Asia & PacificEast Asia & Pacific (excluding high income)East Asia & Pacific (IDA & IBRD countries)EcuadorEgypt, Arab Rep.El SalvadorEritreaEstoniaEthiopiaEuro areaEurope & Central AsiaEurope & Central Asia (excluding high income)Europe & Central Asia (IDA & IBRD countries)European UnionFinlandFragile and conflict affected situationsFranceGabonGeorgiaGermanyGhanaGibraltarGreeceGuatemalaHaitiHeavily indebted poor countries (HIPC)High incomeHondurasHong Kong SAR, ChinaHungaryIBRD onlyIcelandIDA & IBRD totalIDA blendIDA onlyIDA totalIndiaIndonesiaIran, Islamic Rep.IraqIrelandIsraelItalyJamaicaJapanJordanKazakhstanKenyaKorea, Dem. People’s Rep.Korea, Rep.KosovoKuwaitKyrgyz RepublicLate-demographic dividendLatin America & Caribbean Latin America & Caribbean (excluding high income)Latin America & the Caribbean (IDA & IBRD countries)LatviaLeast developed countries: UN classificationLebanonLibyaLithuaniaLow & middle incomeLow incomeLower middle incomeLuxembourgMacedonia, FYRMalaysiaMaltaMauritiusMexicoMiddle East & North AfricaMiddle East & North Africa (excluding high income)Middle East & North Africa (IDA & IBRD countries)Middle incomeMoldovaMongoliaMontenegroMoroccoMozambiqueMyanmarNamibiaNepalNetherlandsNew ZealandNicaraguaNigerNigeriaNorth AmericaNorwayOECD membersOmanOther small statesPakistanPanamaParaguayPeruPhilippinesPolandPortugalPost-demographic dividendPre-demographic dividendQatarRomaniaRussian FederationSaudi ArabiaSenegalSerbiaSingaporeSlovak RepublicSloveniaSmall statesSouth AfricaSouth AsiaSouth Asia (IDA & IBRD)South SudanSpainSri LankaSub-Saharan Africa Sub-Saharan Africa (excluding high income)Sub-Saharan Africa (IDA & IBRD countries)SudanSwedenSwitzerlandSyrian Arab RepublicTajikistanTanzaniaThailandTogoTrinidad and TobagoTunisiaTurkeyTurkmenistanUkraineUnited Arab EmiratesUnited KingdomUnited StatesUpper middle incomeUruguayUzbekistanVenezuela, RBVietnamWorldYemen, Rep.ZambiaZimbabwe Linha do tempo:
Nesta escala de tempo está apresentado um gráfico de 1972 ano até 2014 ano Paraguay. Dados de 1971 ano ausente. O número de observações reais por data: 43.
Fonte (nome):
Indicadores de desenvolvimento mundial
Fonte (organização):
IEA Statistics © OECD/IEA 2014 (http://www.iea.org/stats/index.asp), subject to https://www.iea.org/t&c/termsandconditions/
Categorias:
Environment
Foi atualizado:
23 abr 2017 ano
Indicadores de alterações dos valores ao longo dos anos
Mínimo:
58.571
1 jan 1979 ano
Máximo:
93.306
1 jan 2014 ano
Na data de observação
Valor
Mudança absoluta
A alteração em relação ao valor anterior
1 jan 1972 ano
68.421
+68.421
0.0%
1 jan 1973 ano
66.667
-1.754
-2.56%
1 jan 1974 ano
70.0
+3.333
5.0%
1 jan 1975 ano
68.657
-1.343
-1.92%
1 jan 1976 ano
68.571
-0.085
-0.12%
1 jan 1977 ano
70.513
+1.941
2.83%
1 jan 1978 ano
61.607
-8.906
-12.63%
1 jan 1979 ano
58.571
-3.036
-4.93%
1 jan 1980 ano
68.889
+10.317
17.62%
1 jan 1981 ano
80.741
+11.852
17.2%
1 jan 1982 ano
80.916
+0.175
0.22%
1 jan 1983 ano
79.389
-1.527
-1.89%
1 jan 1984 ano
80.0
+0.611
0.77%
1 jan 1985 ano
81.429
+1.429
1.79%
1 jan 1986 ano
83.803
+2.374
2.92%
1 jan 1987 ano
82.313
-1.49
-1.78%
1 jan 1988 ano
83.23
+0.917
1.11%
1 jan 1989 ano
81.522
-1.708
-2.05%
1 jan 1990 ano
85.246
+3.724
4.57%
1 jan 1991 ano
83.938
-1.308
-1.53%
1 jan 1992 ano
81.383
-2.555
-3.04%
1 jan 1993 ano
81.333
-0.05
-0.06%
1 jan 1994 ano
87.356
+6.023
7.41%
1 jan 1995 ano
83.713
-3.643
-4.17%
1 jan 1996 ano
83.954
+0.241
0.29%
1 jan 1997 ano
85.797
+1.843
2.2%
1 jan 1998 ano
86.684
+0.887
1.03%
1 jan 1999 ano
86.567
-0.117
-0.13%
1 jan 2000 ano
86.352
-0.215
-0.25%
1 jan 2001 ano
85.366
-0.987
-1.14%
1 jan 2002 ano
87.683
+2.317
2.71%
1 jan 2003 ano
88.022
+0.339
0.39%
1 jan 2004 ano
90.836
+2.813
3.2%
1 jan 2005 ano
89.628
-1.208
-1.33%
1 jan 2006 ano
87.896
-1.731
-1.93%
1 jan 2007 ano
89.722
+1.826
2.08%
1 jan 2008 ano
92.761
+3.039
3.39%
1 jan 2009 ano
92.893
+0.132
0.14%
1 jan 2010 ano
92.927
+0.033
0.04%
1 jan 2011 ano
92.489
-0.438
-0.47%
1 jan 2012 ano
93.018
+0.529
0.57%
1 jan 2013 ano
90.873
-2.145
-2.31%
1 jan 2014 ano
93.306
+2.433
2.68%
Classificação de países por estatísticas atuais por anos


Comentários: