29
/pt/
pt
AIzaSyAYiBZKx7MnpbEhh9jyipgxe19OcubqV5w
April 1, 2024
234466
Saudi Arabia
SAU
true
2
1
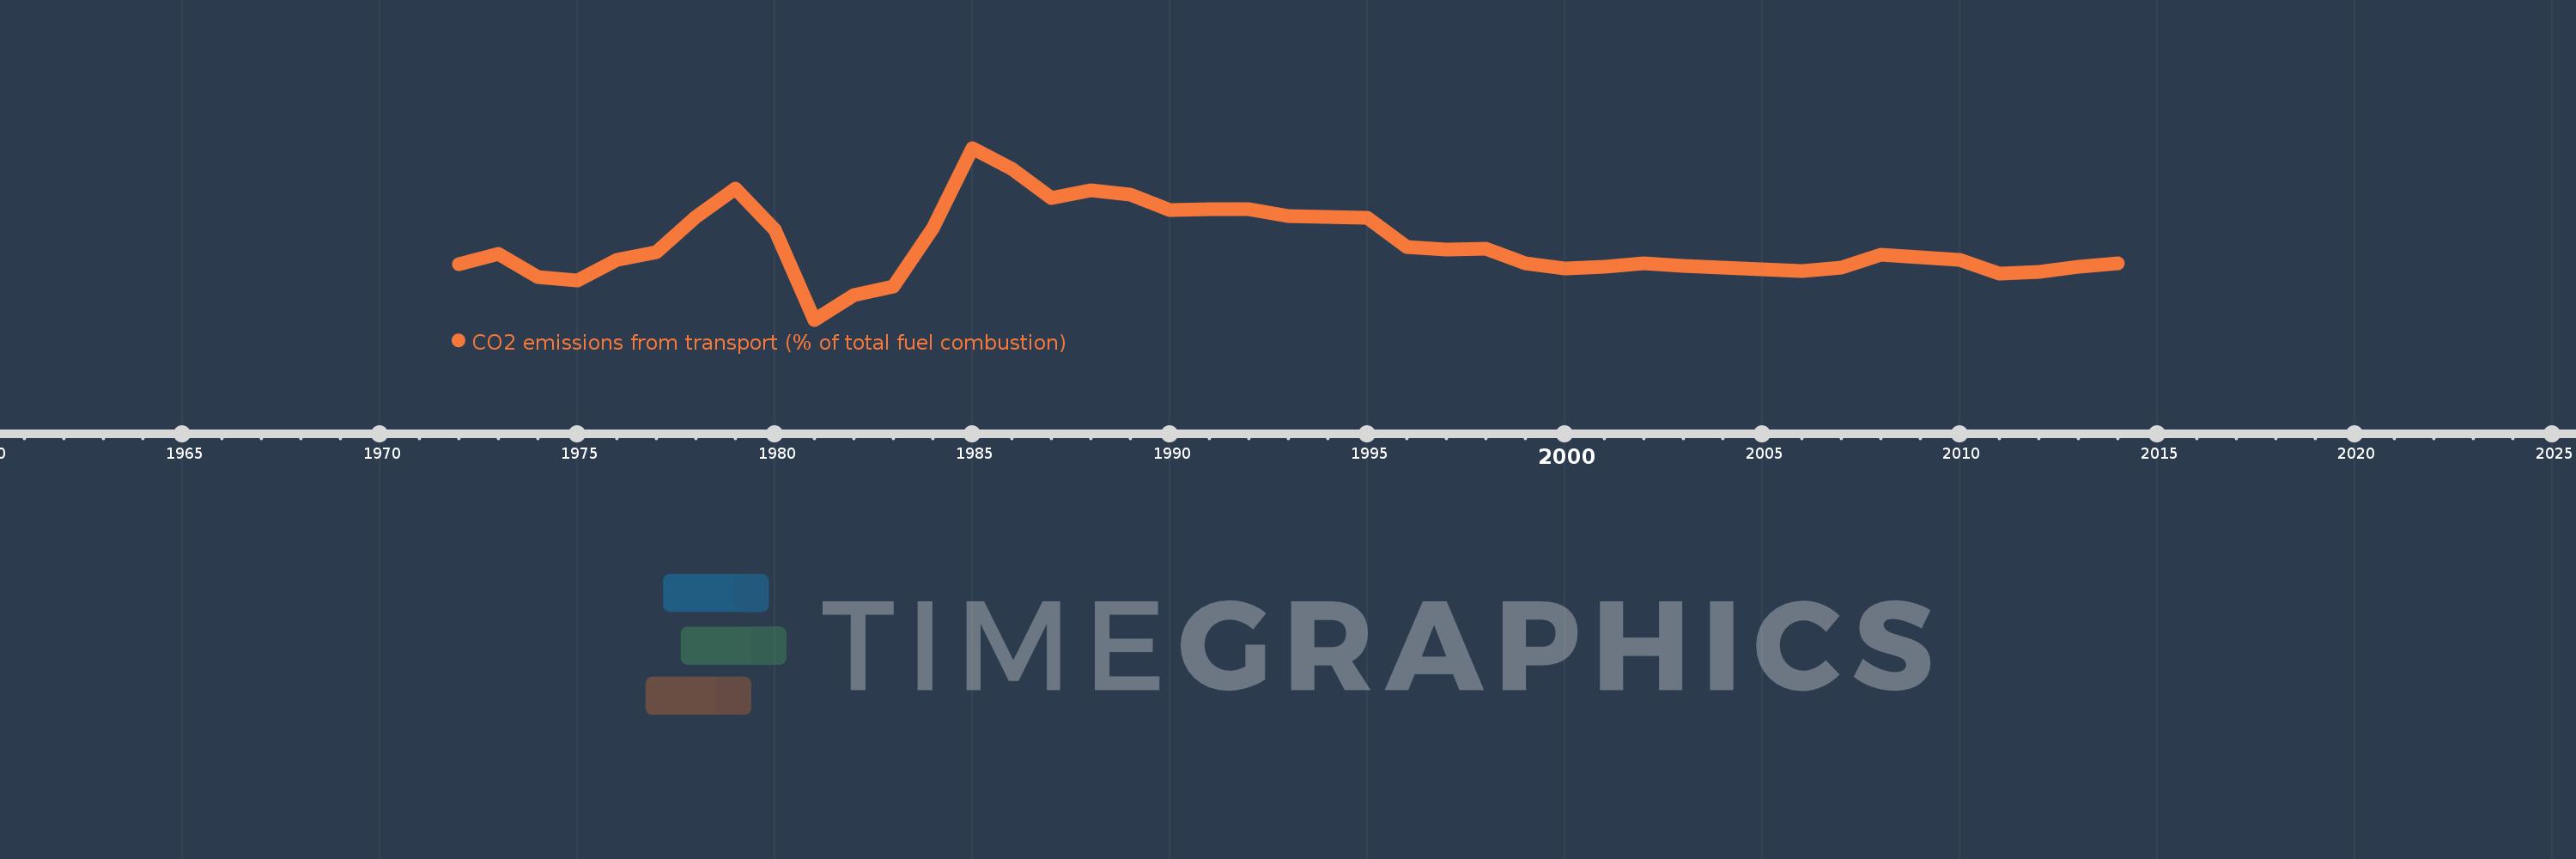
CO2 emissions from transport (% of total fuel combustion)
2014,2013,2012,2011,2010,2009,2008,2007,2006,2005,2004,2003,2002,2001,2000,1999,1998,1997,1996,1995,1994,1993,1992,1991,1990,1989,1988,1987,1986,1985,1984,1983,1982,1981,1980,1979,1978,1977,1976,1975,1974,1973,1972
Estas estatísticas em outros países:
AlbaniaAlgeriaAngolaArab WorldArgentinaArmeniaAustraliaAustriaAzerbaijanBahrainBangladeshBelarusBelgiumBeninBoliviaBosnia and HerzegovinaBotswanaBrazilBrunei DarussalamBulgariaCambodiaCameroonCanadaCaribbean small statesCentral Europe and the BalticsChileChinaColombiaCongo, Dem. Rep.Congo, Rep.Costa RicaCote d'IvoireCroatiaCubaCuracaoCyprusCzech RepublicDenmarkDominican RepublicEarly-demographic dividendEast Asia & PacificEast Asia & Pacific (excluding high income)East Asia & Pacific (IDA & IBRD countries)EcuadorEgypt, Arab Rep.El SalvadorEritreaEstoniaEthiopiaEuro areaEurope & Central AsiaEurope & Central Asia (excluding high income)Europe & Central Asia (IDA & IBRD countries)European UnionFinlandFragile and conflict affected situationsFranceGabonGeorgiaGermanyGhanaGibraltarGreeceGuatemalaHaitiHeavily indebted poor countries (HIPC)High incomeHondurasHong Kong SAR, ChinaHungaryIBRD onlyIcelandIDA & IBRD totalIDA blendIDA onlyIDA totalIndiaIndonesiaIran, Islamic Rep.IraqIrelandIsraelItalyJamaicaJapanJordanKazakhstanKenyaKorea, Dem. People’s Rep.Korea, Rep.KosovoKuwaitKyrgyz RepublicLate-demographic dividendLatin America & Caribbean Latin America & Caribbean (excluding high income)Latin America & the Caribbean (IDA & IBRD countries)LatviaLeast developed countries: UN classificationLebanonLibyaLithuaniaLow & middle incomeLow incomeLower middle incomeLuxembourgMacedonia, FYRMalaysiaMaltaMauritiusMexicoMiddle East & North AfricaMiddle East & North Africa (excluding high income)Middle East & North Africa (IDA & IBRD countries)Middle incomeMoldovaMongoliaMontenegroMoroccoMozambiqueMyanmarNamibiaNepalNetherlandsNew ZealandNicaraguaNigerNigeriaNorth AmericaNorwayOECD membersOmanOther small statesPakistanPanamaParaguayPeruPhilippinesPolandPortugalPost-demographic dividendPre-demographic dividendQatarRomaniaRussian FederationSaudi ArabiaSenegalSerbiaSingaporeSlovak RepublicSloveniaSmall statesSouth AfricaSouth AsiaSouth Asia (IDA & IBRD)South SudanSpainSri LankaSub-Saharan Africa Sub-Saharan Africa (excluding high income)Sub-Saharan Africa (IDA & IBRD countries)SudanSwedenSwitzerlandSyrian Arab RepublicTajikistanTanzaniaThailandTogoTrinidad and TobagoTunisiaTurkeyTurkmenistanUkraineUnited Arab EmiratesUnited KingdomUnited StatesUpper middle incomeUruguayUzbekistanVenezuela, RBVietnamWorldYemen, Rep.ZambiaZimbabwe Linha do tempo:
Nesta escala de tempo está apresentado um gráfico de 1972 ano até 2014 ano Saudi Arabia. Dados de 1971 ano ausente. O número de observações reais por data: 43.
Fonte (nome):
Indicadores de desenvolvimento mundial
Fonte (organização):
IEA Statistics © OECD/IEA 2014 (http://www.iea.org/stats/index.asp), subject to https://www.iea.org/t&c/termsandconditions/
Categorias:
Environment
Foi atualizado:
23 abr 2017 ano
Indicadores de alterações dos valores ao longo dos anos
Mínimo:
19.696
1 jan 1981 ano
Máximo:
39.928
1 jan 1985 ano
Na data de observação
Valor
Mudança absoluta
A alteração em relação ao valor anterior
1 jan 1972 ano
26.204
+26.204
0.0%
1 jan 1973 ano
27.412
+1.208
4.61%
1 jan 1974 ano
24.772
-2.639
-9.63%
1 jan 1975 ano
24.356
-0.416
-1.68%
1 jan 1976 ano
26.788
+2.432
9.98%
1 jan 1977 ano
27.683
+0.895
3.34%
1 jan 1978 ano
31.775
+4.091
14.78%
1 jan 1979 ano
35.169
+3.395
10.68%
1 jan 1980 ano
30.291
-4.879
-13.87%
1 jan 1981 ano
19.696
-10.594
-34.98%
1 jan 1982 ano
22.568
+2.871
14.58%
1 jan 1983 ano
23.618
+1.051
4.66%
1 jan 1984 ano
30.512
+6.894
29.19%
1 jan 1985 ano
39.928
+9.416
30.86%
1 jan 1986 ano
37.426
-2.503
-6.27%
1 jan 1987 ano
34.054
-3.372
-9.01%
1 jan 1988 ano
34.893
+0.839
2.46%
1 jan 1989 ano
34.471
-0.422
-1.21%
1 jan 1990 ano
32.635
-1.835
-5.32%
1 jan 1991 ano
32.691
+0.056
0.17%
1 jan 1992 ano
32.721
+0.03
0.09%
1 jan 1993 ano
31.954
-0.767
-2.34%
1 jan 1994 ano
31.761
-0.193
-0.61%
1 jan 1995 ano
31.725
-0.035
-0.11%
1 jan 1996 ano
28.243
-3.482
-10.97%
1 jan 1997 ano
27.942
-0.301
-1.07%
1 jan 1998 ano
28.058
+0.116
0.41%
1 jan 1999 ano
26.298
-1.76
-6.27%
1 jan 2000 ano
25.704
-0.594
-2.26%
1 jan 2001 ano
25.975
+0.271
1.05%
1 jan 2002 ano
26.318
+0.343
1.32%
1 jan 2003 ano
26.013
-0.305
-1.16%
1 jan 2004 ano
25.79
-0.223
-0.86%
1 jan 2005 ano
25.585
-0.205
-0.79%
1 jan 2006 ano
25.42
-0.166
-0.65%
1 jan 2007 ano
25.852
+0.433
1.7%
1 jan 2008 ano
27.391
+1.539
5.95%
1 jan 2009 ano
27.051
-0.34
-1.24%
1 jan 2010 ano
26.761
-0.291
-1.07%
1 jan 2011 ano
25.144
-1.616
-6.04%
1 jan 2012 ano
25.37
+0.226
0.9%
1 jan 2013 ano
25.985
+0.615
2.42%
1 jan 2014 ano
26.362
+0.377
1.45%
Classificação de países por estatísticas atuais por anos


Comentários: