29
/pt/
pt
AIzaSyAYiBZKx7MnpbEhh9jyipgxe19OcubqV5w
April 1, 2024
187553
Malaysia
MYS
true
2
1
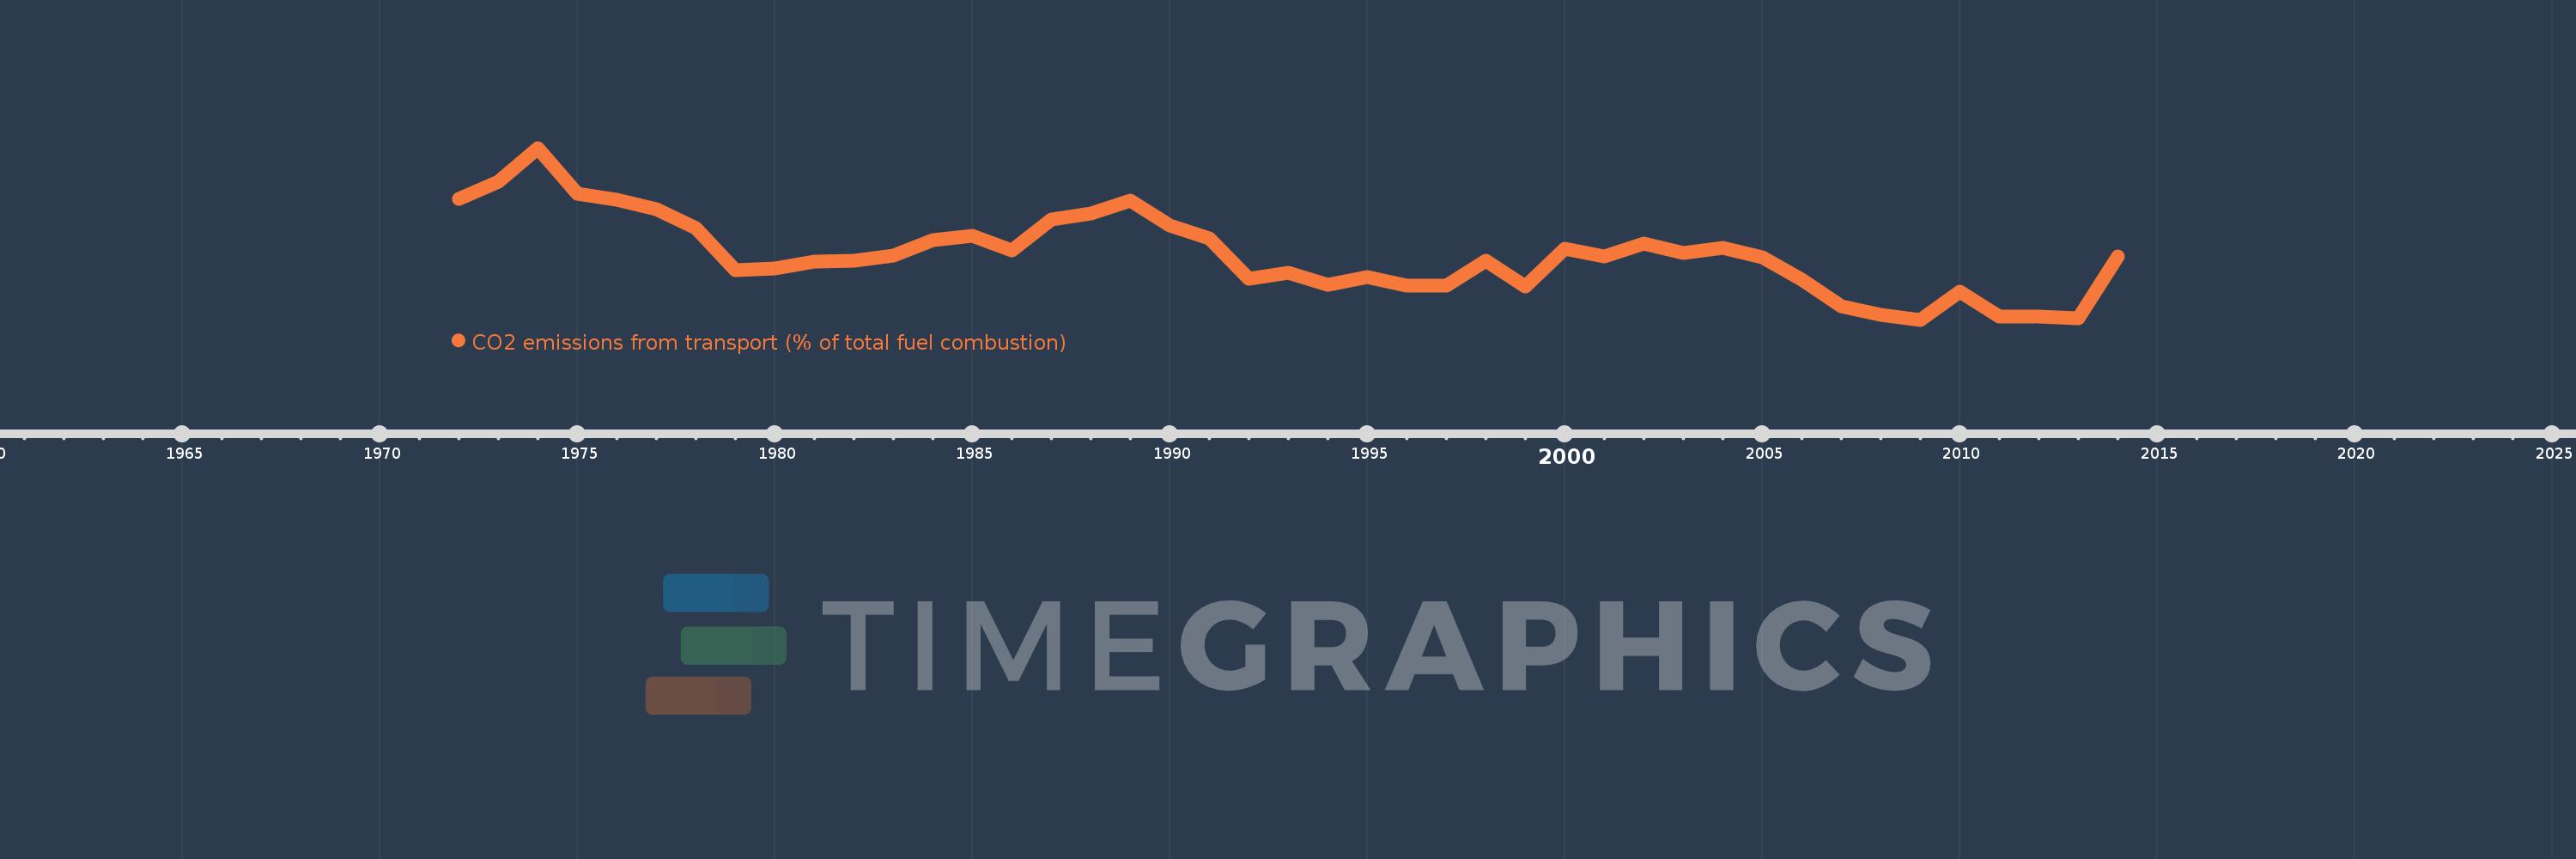
CO2 emissions from transport (% of total fuel combustion)
2014,2013,2012,2011,2010,2009,2008,2007,2006,2005,2004,2003,2002,2001,2000,1999,1998,1997,1996,1995,1994,1993,1992,1991,1990,1989,1988,1987,1986,1985,1984,1983,1982,1981,1980,1979,1978,1977,1976,1975,1974,1973,1972
Estas estatísticas em outros países:
AlbaniaAlgeriaAngolaArab WorldArgentinaArmeniaAustraliaAustriaAzerbaijanBahrainBangladeshBelarusBelgiumBeninBoliviaBosnia and HerzegovinaBotswanaBrazilBrunei DarussalamBulgariaCambodiaCameroonCanadaCaribbean small statesCentral Europe and the BalticsChileChinaColombiaCongo, Dem. Rep.Congo, Rep.Costa RicaCote d'IvoireCroatiaCubaCuracaoCyprusCzech RepublicDenmarkDominican RepublicEarly-demographic dividendEast Asia & PacificEast Asia & Pacific (excluding high income)East Asia & Pacific (IDA & IBRD countries)EcuadorEgypt, Arab Rep.El SalvadorEritreaEstoniaEthiopiaEuro areaEurope & Central AsiaEurope & Central Asia (excluding high income)Europe & Central Asia (IDA & IBRD countries)European UnionFinlandFragile and conflict affected situationsFranceGabonGeorgiaGermanyGhanaGibraltarGreeceGuatemalaHaitiHeavily indebted poor countries (HIPC)High incomeHondurasHong Kong SAR, ChinaHungaryIBRD onlyIcelandIDA & IBRD totalIDA blendIDA onlyIDA totalIndiaIndonesiaIran, Islamic Rep.IraqIrelandIsraelItalyJamaicaJapanJordanKazakhstanKenyaKorea, Dem. People’s Rep.Korea, Rep.KosovoKuwaitKyrgyz RepublicLate-demographic dividendLatin America & Caribbean Latin America & Caribbean (excluding high income)Latin America & the Caribbean (IDA & IBRD countries)LatviaLeast developed countries: UN classificationLebanonLibyaLithuaniaLow & middle incomeLow incomeLower middle incomeLuxembourgMacedonia, FYRMalaysiaMaltaMauritiusMexicoMiddle East & North AfricaMiddle East & North Africa (excluding high income)Middle East & North Africa (IDA & IBRD countries)Middle incomeMoldovaMongoliaMontenegroMoroccoMozambiqueMyanmarNamibiaNepalNetherlandsNew ZealandNicaraguaNigerNigeriaNorth AmericaNorwayOECD membersOmanOther small statesPakistanPanamaParaguayPeruPhilippinesPolandPortugalPost-demographic dividendPre-demographic dividendQatarRomaniaRussian FederationSaudi ArabiaSenegalSerbiaSingaporeSlovak RepublicSloveniaSmall statesSouth AfricaSouth AsiaSouth Asia (IDA & IBRD)South SudanSpainSri LankaSub-Saharan Africa Sub-Saharan Africa (excluding high income)Sub-Saharan Africa (IDA & IBRD countries)SudanSwedenSwitzerlandSyrian Arab RepublicTajikistanTanzaniaThailandTogoTrinidad and TobagoTunisiaTurkeyTurkmenistanUkraineUnited Arab EmiratesUnited KingdomUnited StatesUpper middle incomeUruguayUzbekistanVenezuela, RBVietnamWorldYemen, Rep.ZambiaZimbabwe Linha do tempo:
Nesta escala de tempo está apresentado um gráfico de 1972 ano até 2014 ano Malaysia. Dados de 1971 ano ausente. O número de observações reais por data: 43.
Fonte (nome):
Indicadores de desenvolvimento mundial
Fonte (organização):
IEA Statistics © OECD/IEA 2014 (http://www.iea.org/stats/index.asp), subject to https://www.iea.org/t&c/termsandconditions/
Categorias:
Environment
Foi atualizado:
23 abr 2017 ano
Indicadores de alterações dos valores ao longo dos anos
Mínimo:
22.407
1 jan 2009 ano
Máximo:
35.945
1 jan 1974 ano
Na data de observação
Valor
Mudança absoluta
A alteração em relação ao valor anterior
1 jan 1972 ano
31.9
+31.9
0.0%
1 jan 1973 ano
33.28
+1.38
4.33%
1 jan 1974 ano
35.945
+2.664
8.01%
1 jan 1975 ano
32.305
-3.64
-10.13%
1 jan 1976 ano
31.894
-0.411
-1.27%
1 jan 1977 ano
31.105
-0.789
-2.47%
1 jan 1978 ano
29.657
-1.448
-4.65%
1 jan 1979 ano
26.286
-3.371
-11.37%
1 jan 1980 ano
26.449
+0.163
0.62%
1 jan 1981 ano
26.973
+0.524
1.98%
1 jan 1982 ano
27.061
+0.088
0.33%
1 jan 1983 ano
27.447
+0.386
1.43%
1 jan 1984 ano
28.659
+1.211
4.41%
1 jan 1985 ano
29.014
+0.355
1.24%
1 jan 1986 ano
27.872
-1.142
-3.93%
1 jan 1987 ano
30.312
+2.44
8.75%
1 jan 1988 ano
30.774
+0.461
1.52%
1 jan 1989 ano
31.828
+1.055
3.43%
1 jan 1990 ano
29.804
-2.024
-6.36%
1 jan 1991 ano
28.815
-0.989
-3.32%
1 jan 1992 ano
25.626
-3.189
-11.07%
1 jan 1993 ano
26.089
+0.463
1.81%
1 jan 1994 ano
25.145
-0.944
-3.62%
1 jan 1995 ano
25.777
+0.632
2.51%
1 jan 1996 ano
25.079
-0.698
-2.71%
1 jan 1997 ano
25.064
-0.015
-0.06%
1 jan 1998 ano
27.033
+1.969
7.86%
1 jan 1999 ano
25.0
-2.033
-7.52%
1 jan 2000 ano
28.02
+3.02
12.08%
1 jan 2001 ano
27.399
-0.621
-2.22%
1 jan 2002 ano
28.401
+1.002
3.66%
1 jan 2003 ano
27.695
-0.706
-2.49%
1 jan 2004 ano
28.105
+0.409
1.48%
1 jan 2005 ano
27.335
-0.77
-2.74%
1 jan 2006 ano
25.543
-1.791
-6.55%
1 jan 2007 ano
23.492
-2.051
-8.03%
1 jan 2008 ano
22.765
-0.727
-3.1%
1 jan 2009 ano
22.407
-0.357
-1.57%
1 jan 2010 ano
24.611
+2.204
9.84%
1 jan 2011 ano
22.647
-1.964
-7.98%
1 jan 2012 ano
22.687
+0.04
0.18%
1 jan 2013 ano
22.514
-0.174
-0.77%
1 jan 2014 ano
27.363
+4.85
21.54%
Classificação de países por estatísticas atuais por anos


Comentários: