29
/pt/
pt
AIzaSyAYiBZKx7MnpbEhh9jyipgxe19OcubqV5w
April 1, 2024
27136
East Asia & Pacific
EAS
false
2
1
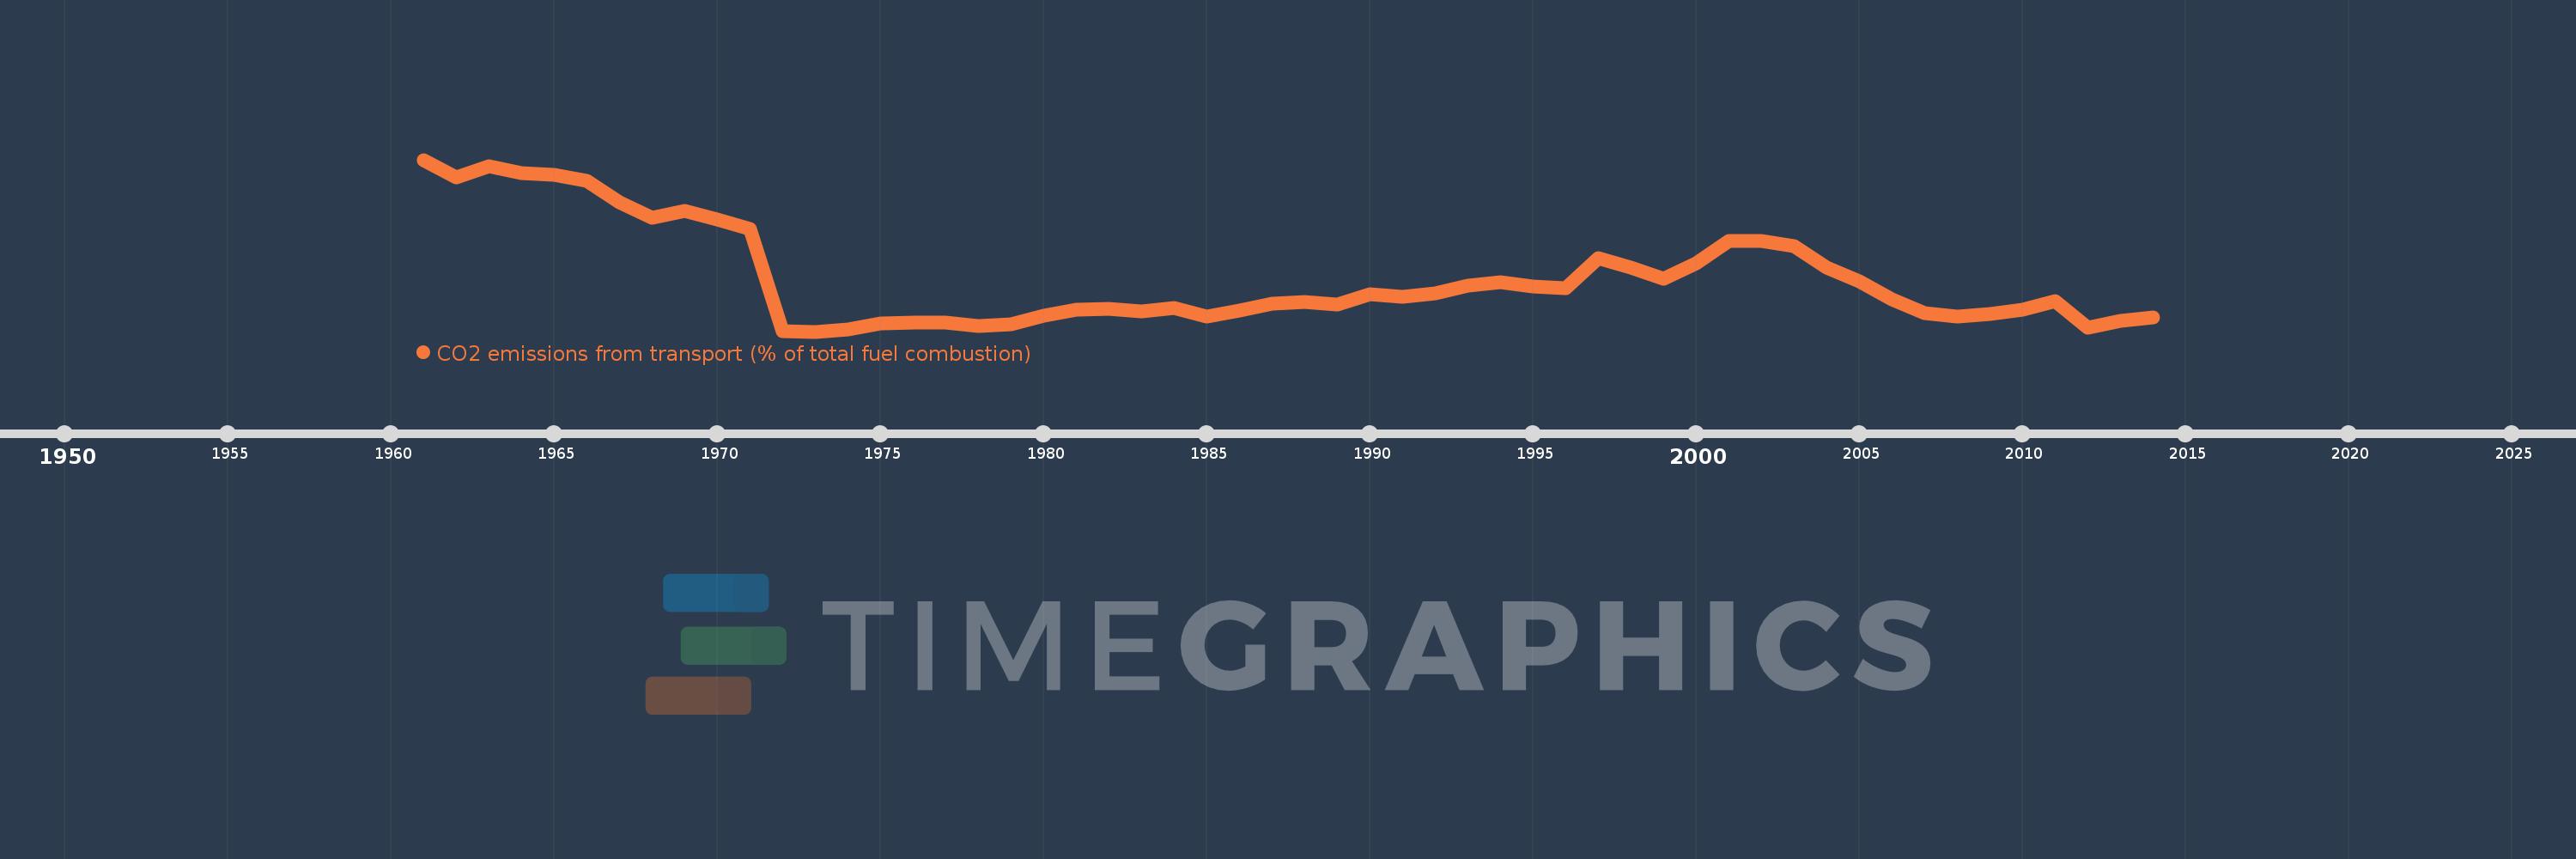
CO2 emissions from transport (% of total fuel combustion)
2014,2013,2012,2011,2010,2009,2008,2007,2006,2005,2004,2003,2002,2001,2000,1999,1998,1997,1996,1995,1994,1993,1992,1991,1990,1989,1988,1987,1986,1985,1984,1983,1982,1981,1980,1979,1978,1977,1976,1975,1974,1973,1972,1971,1970,1969,1968,1967,1966,1965,1964,1963,1962,1961
Estas estatísticas em outros países:
AlbaniaAlgeriaAngolaArab WorldArgentinaArmeniaAustraliaAustriaAzerbaijanBahrainBangladeshBelarusBelgiumBeninBoliviaBosnia and HerzegovinaBotswanaBrazilBrunei DarussalamBulgariaCambodiaCameroonCanadaCaribbean small statesCentral Europe and the BalticsChileChinaColombiaCongo, Dem. Rep.Congo, Rep.Costa RicaCote d'IvoireCroatiaCubaCuracaoCyprusCzech RepublicDenmarkDominican RepublicEarly-demographic dividendEast Asia & PacificEast Asia & Pacific (excluding high income)East Asia & Pacific (IDA & IBRD countries)EcuadorEgypt, Arab Rep.El SalvadorEritreaEstoniaEthiopiaEuro areaEurope & Central AsiaEurope & Central Asia (excluding high income)Europe & Central Asia (IDA & IBRD countries)European UnionFinlandFragile and conflict affected situationsFranceGabonGeorgiaGermanyGhanaGibraltarGreeceGuatemalaHaitiHeavily indebted poor countries (HIPC)High incomeHondurasHong Kong SAR, ChinaHungaryIBRD onlyIcelandIDA & IBRD totalIDA blendIDA onlyIDA totalIndiaIndonesiaIran, Islamic Rep.IraqIrelandIsraelItalyJamaicaJapanJordanKazakhstanKenyaKorea, Dem. People’s Rep.Korea, Rep.KosovoKuwaitKyrgyz RepublicLate-demographic dividendLatin America & Caribbean Latin America & Caribbean (excluding high income)Latin America & the Caribbean (IDA & IBRD countries)LatviaLeast developed countries: UN classificationLebanonLibyaLithuaniaLow & middle incomeLow incomeLower middle incomeLuxembourgMacedonia, FYRMalaysiaMaltaMauritiusMexicoMiddle East & North AfricaMiddle East & North Africa (excluding high income)Middle East & North Africa (IDA & IBRD countries)Middle incomeMoldovaMongoliaMontenegroMoroccoMozambiqueMyanmarNamibiaNepalNetherlandsNew ZealandNicaraguaNigerNigeriaNorth AmericaNorwayOECD membersOmanOther small statesPakistanPanamaParaguayPeruPhilippinesPolandPortugalPost-demographic dividendPre-demographic dividendQatarRomaniaRussian FederationSaudi ArabiaSenegalSerbiaSingaporeSlovak RepublicSloveniaSmall statesSouth AfricaSouth AsiaSouth Asia (IDA & IBRD)South SudanSpainSri LankaSub-Saharan Africa Sub-Saharan Africa (excluding high income)Sub-Saharan Africa (IDA & IBRD countries)SudanSwedenSwitzerlandSyrian Arab RepublicTajikistanTanzaniaThailandTogoTrinidad and TobagoTunisiaTurkeyTurkmenistanUkraineUnited Arab EmiratesUnited KingdomUnited StatesUpper middle incomeUruguayUzbekistanVenezuela, RBVietnamWorldYemen, Rep.ZambiaZimbabwe Linha do tempo:
Nesta escala de tempo está apresentado um gráfico de 1961 ano até 2014 ano East Asia & Pacific. Dados de 1960 ano ausente. O número de observações reais por data: 54.
Fonte (nome):
Indicadores de desenvolvimento mundial
Fonte (organização):
IEA Statistics © OECD/IEA 2014 (http://www.iea.org/stats/index.asp), subject to https://www.iea.org/t&c/termsandconditions/
Categorias:
Environment
Foi atualizado:
23 abr 2017 ano
Indicadores de alterações dos valores ao longo dos anos
Mínimo:
11.561
1 jan 1973 ano
Máximo:
17.677
1 jan 1961 ano
Na data de observação
Valor
Mudança absoluta
A alteração em relação ao valor anterior
1 jan 1961 ano
17.677
+17.677
0.0%
1 jan 1962 ano
17.053
-0.624
-3.53%
1 jan 1963 ano
17.447
+0.394
2.31%
1 jan 1964 ano
17.196
-0.251
-1.44%
1 jan 1965 ano
17.141
-0.055
-0.32%
1 jan 1966 ano
16.92
-0.221
-1.29%
1 jan 1967 ano
16.157
-0.763
-4.51%
1 jan 1968 ano
15.609
-0.548
-3.39%
1 jan 1969 ano
15.87
+0.261
1.67%
1 jan 1970 ano
15.554
-0.316
-1.99%
1 jan 1971 ano
15.202
-0.352
-2.26%
1 jan 1972 ano
11.589
-3.613
-23.77%
1 jan 1973 ano
11.561
-0.028
-0.24%
1 jan 1974 ano
11.647
+0.086
0.74%
1 jan 1975 ano
11.856
+0.209
1.8%
1 jan 1976 ano
11.877
+0.021
0.18%
1 jan 1977 ano
11.875
-0.002
-0.02%
1 jan 1978 ano
11.746
-0.129
-1.08%
1 jan 1979 ano
11.816
+0.07
0.6%
1 jan 1980 ano
12.142
+0.326
2.76%
1 jan 1981 ano
12.336
+0.194
1.6%
1 jan 1982 ano
12.365
+0.029
0.23%
1 jan 1983 ano
12.287
-0.078
-0.63%
1 jan 1984 ano
12.405
+0.118
0.96%
1 jan 1985 ano
12.087
-0.317
-2.56%
1 jan 1986 ano
12.316
+0.228
1.89%
1 jan 1987 ano
12.545
+0.229
1.86%
1 jan 1988 ano
12.602
+0.057
0.46%
1 jan 1989 ano
12.519
-0.083
-0.66%
1 jan 1990 ano
12.876
+0.357
2.85%
1 jan 1991 ano
12.793
-0.082
-0.64%
1 jan 1992 ano
12.937
+0.143
1.12%
1 jan 1993 ano
13.196
+0.259
2.01%
1 jan 1994 ano
13.323
+0.127
0.96%
1 jan 1995 ano
13.162
-0.161
-1.21%
1 jan 1996 ano
13.115
-0.047
-0.36%
1 jan 1997 ano
14.162
+1.047
7.98%
1 jan 1998 ano
13.852
-0.31
-2.19%
1 jan 1999 ano
13.445
-0.407
-2.94%
1 jan 2000 ano
14.007
+0.562
4.18%
1 jan 2001 ano
14.8
+0.794
5.67%
1 jan 2002 ano
14.797
-0.003
-0.02%
1 jan 2003 ano
14.606
-0.191
-1.29%
1 jan 2004 ano
13.854
-0.752
-5.15%
1 jan 2005 ano
13.356
-0.498
-3.59%
1 jan 2006 ano
12.717
-0.639
-4.79%
1 jan 2007 ano
12.207
-0.51
-4.01%
1 jan 2008 ano
12.098
-0.109
-0.89%
1 jan 2009 ano
12.199
+0.101
0.84%
1 jan 2010 ano
12.34
+0.141
1.16%
1 jan 2011 ano
12.632
+0.292
2.36%
1 jan 2012 ano
11.705
-0.927
-7.34%
1 jan 2013 ano
11.934
+0.229
1.96%
1 jan 2014 ano
12.053
+0.119
1.0%
Classificação de países por estatísticas atuais por anos


Comentários: