29
/pt/
pt
AIzaSyAYiBZKx7MnpbEhh9jyipgxe19OcubqV5w
April 1, 2024
72785
Australia
AUS
true
2
1
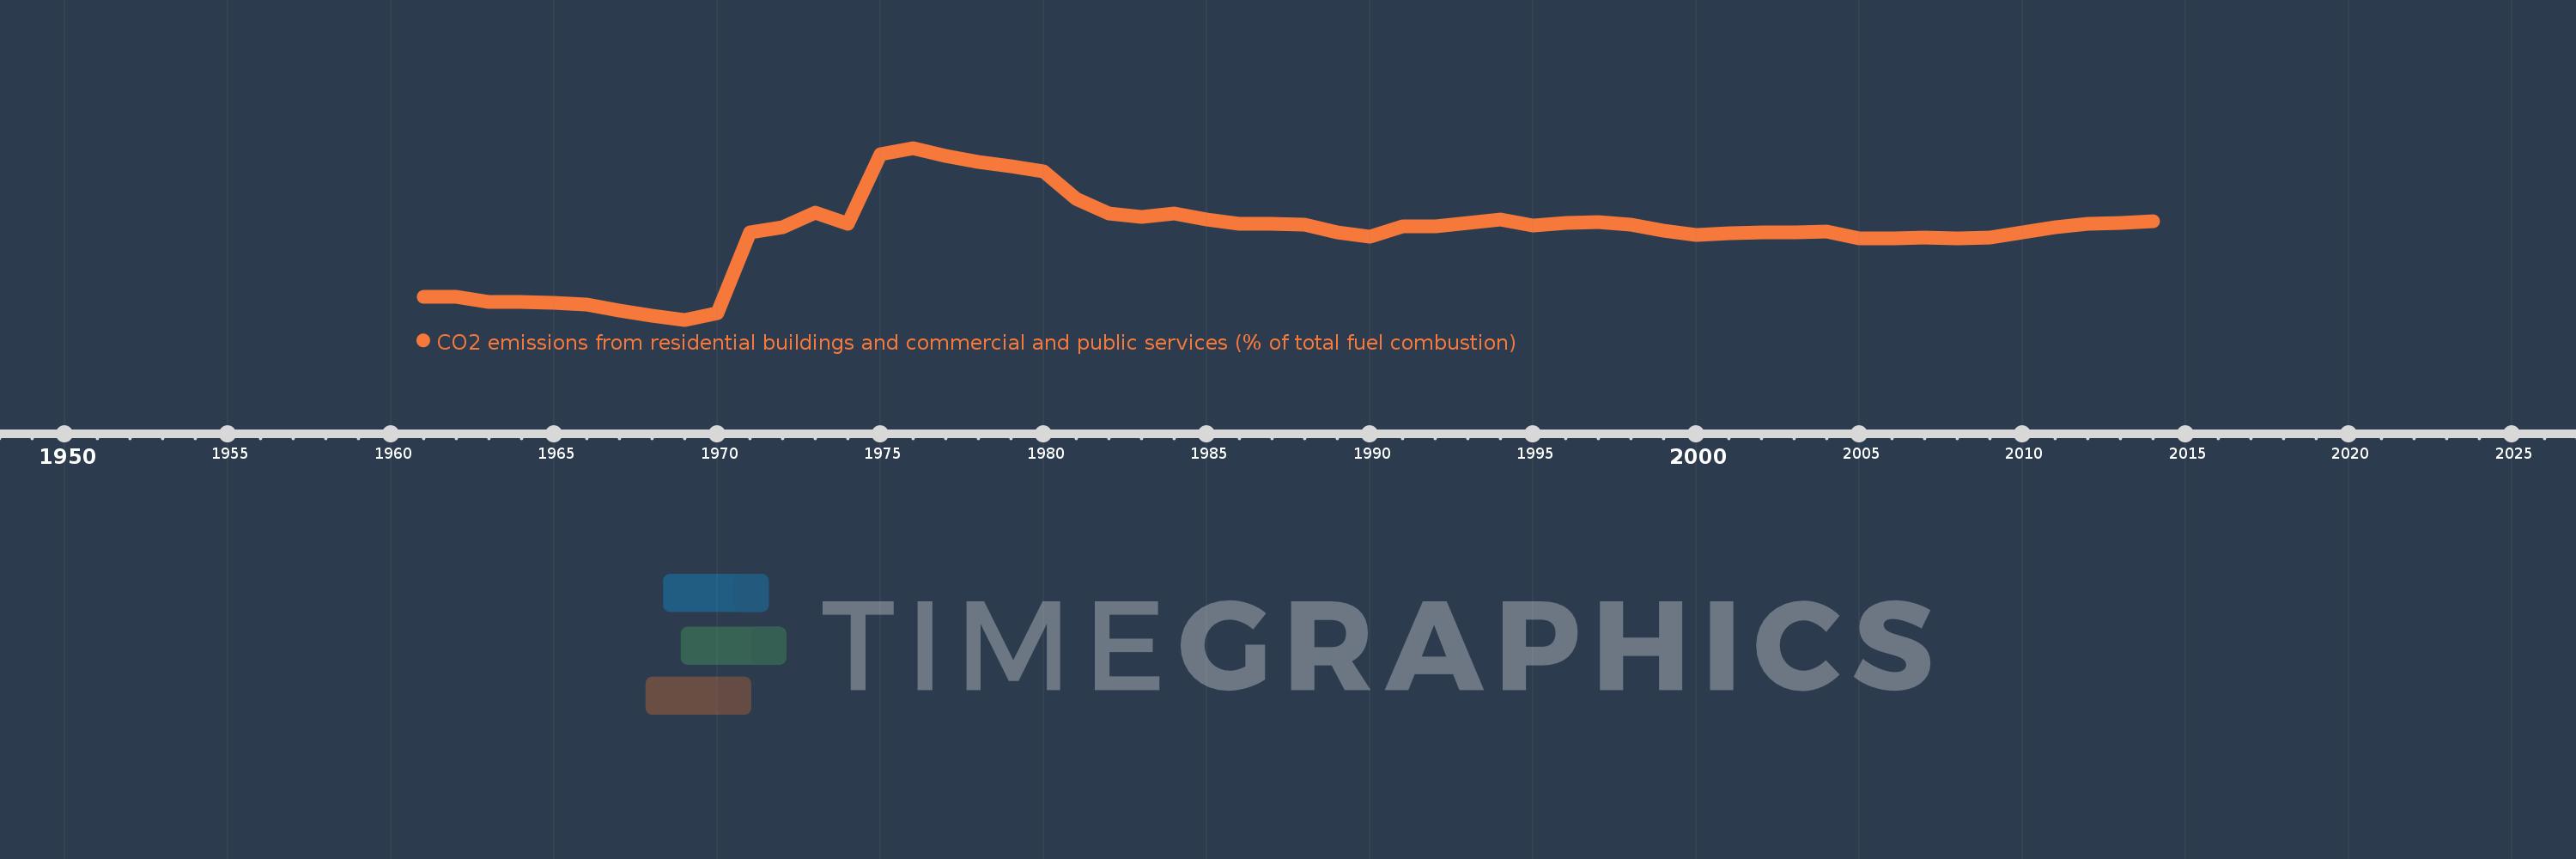
CO2 emissions from residential buildings and commercial and public services (% of total fuel combustion)
2014,2013,2012,2011,2010,2009,2008,2007,2006,2005,2004,2003,2002,2001,2000,1999,1998,1997,1996,1995,1994,1993,1992,1991,1990,1989,1988,1987,1986,1985,1984,1983,1982,1981,1980,1979,1978,1977,1976,1975,1974,1973,1972,1971,1970,1969,1968,1967,1966,1965,1964,1963,1962,1961
Estas estatísticas em outros países:
AlbaniaAlgeriaAngolaArab WorldArgentinaArmeniaAustraliaAustriaAzerbaijanBahrainBangladeshBelarusBelgiumBeninBoliviaBosnia and HerzegovinaBotswanaBrazilBrunei DarussalamBulgariaCambodiaCameroonCanadaCaribbean small statesCentral Europe and the BalticsChileChinaColombiaCongo, Dem. Rep.Congo, Rep.Costa RicaCote d'IvoireCroatiaCubaCuracaoCyprusCzech RepublicDenmarkDominican RepublicEarly-demographic dividendEast Asia & PacificEast Asia & Pacific (excluding high income)East Asia & Pacific (IDA & IBRD countries)EcuadorEgypt, Arab Rep.El SalvadorEritreaEstoniaEthiopiaEuro areaEurope & Central AsiaEurope & Central Asia (excluding high income)Europe & Central Asia (IDA & IBRD countries)European UnionFinlandFragile and conflict affected situationsFranceGabonGeorgiaGermanyGhanaGibraltarGreeceGuatemalaHaitiHeavily indebted poor countries (HIPC)High incomeHondurasHong Kong SAR, ChinaHungaryIBRD onlyIcelandIDA & IBRD totalIDA blendIDA onlyIDA totalIndiaIndonesiaIran, Islamic Rep.IraqIrelandIsraelItalyJamaicaJapanJordanKazakhstanKenyaKorea, Dem. People’s Rep.Korea, Rep.KosovoKuwaitKyrgyz RepublicLate-demographic dividendLatin America & Caribbean Latin America & Caribbean (excluding high income)Latin America & the Caribbean (IDA & IBRD countries)LatviaLeast developed countries: UN classificationLebanonLibyaLithuaniaLow & middle incomeLow incomeLower middle incomeLuxembourgMacedonia, FYRMalaysiaMaltaMauritiusMexicoMiddle East & North AfricaMiddle East & North Africa (excluding high income)Middle East & North Africa (IDA & IBRD countries)Middle incomeMoldovaMongoliaMontenegroMoroccoMozambiqueMyanmarNamibiaNepalNetherlandsNew ZealandNicaraguaNigerNigeriaNorth AmericaNorwayOECD membersOmanOther small statesPakistanPanamaParaguayPeruPhilippinesPolandPortugalPost-demographic dividendPre-demographic dividendQatarRomaniaRussian FederationSaudi ArabiaSenegalSerbiaSingaporeSlovak RepublicSloveniaSmall statesSouth AfricaSouth AsiaSouth Asia (IDA & IBRD)South SudanSpainSri LankaSub-Saharan Africa Sub-Saharan Africa (excluding high income)Sub-Saharan Africa (IDA & IBRD countries)SudanSwedenSwitzerlandSyrian Arab RepublicTajikistanTanzaniaThailandTogoTrinidad and TobagoTunisiaTurkeyTurkmenistanUkraineUnited Arab EmiratesUnited KingdomUnited StatesUpper middle incomeUruguayUzbekistanVenezuela, RBVietnamWorldYemen, Rep.ZambiaZimbabwe Linha do tempo:
Nesta escala de tempo está apresentado um gráfico de 1961 ano até 2014 ano Australia. Dados de 1960 ano ausente. O número de observações reais por data: 54.
Fonte (nome):
Indicadores de desenvolvimento mundial
Fonte (organização):
IEA Statistics © OECD/IEA 2014 (http://www.iea.org/stats/index.asp), subject to https://www.iea.org/t&c/termsandconditions/
Categorias:
Environment
Foi atualizado:
23 abr 2017 ano
Indicadores de alterações dos valores ao longo dos anos
Mínimo:
1.229
1 jan 1969 ano
Máximo:
5.077
1 jan 1976 ano
Na data de observação
Valor
Mudança absoluta
A alteração em relação ao valor anterior
1 jan 1961 ano
1.741
+1.741
0.0%
1 jan 1962 ano
1.741
+0.0
0.02%
1 jan 1963 ano
1.631
-0.11
-6.32%
1 jan 1964 ano
1.63
-0.002
-0.11%
1 jan 1965 ano
1.614
-0.016
-0.99%
1 jan 1966 ano
1.563
-0.05
-3.13%
1 jan 1967 ano
1.432
-0.131
-8.38%
1 jan 1968 ano
1.323
-0.109
-7.62%
1 jan 1969 ano
1.229
-0.094
-7.1%
1 jan 1970 ano
1.371
+0.142
11.52%
1 jan 1971 ano
3.177
+1.807
131.81%
1 jan 1972 ano
3.299
+0.122
3.84%
1 jan 1973 ano
3.625
+0.326
9.87%
1 jan 1974 ano
3.373
-0.252
-6.95%
1 jan 1975 ano
4.938
+1.565
46.4%
1 jan 1976 ano
5.077
+0.138
2.8%
1 jan 1977 ano
4.904
-0.172
-3.39%
1 jan 1978 ano
4.773
-0.132
-2.69%
1 jan 1979 ano
4.668
-0.105
-2.19%
1 jan 1980 ano
4.55
-0.118
-2.54%
1 jan 1981 ano
3.928
-0.622
-13.67%
1 jan 1982 ano
3.602
-0.325
-8.28%
1 jan 1983 ano
3.538
-0.064
-1.79%
1 jan 1984 ano
3.618
+0.08
2.26%
1 jan 1985 ano
3.475
-0.143
-3.95%
1 jan 1986 ano
3.375
-0.1
-2.88%
1 jan 1987 ano
3.381
+0.006
0.18%
1 jan 1988 ano
3.364
-0.017
-0.5%
1 jan 1989 ano
3.185
-0.18
-5.34%
1 jan 1990 ano
3.099
-0.086
-2.71%
1 jan 1991 ano
3.321
+0.223
7.18%
1 jan 1992 ano
3.325
+0.004
0.12%
1 jan 1993 ano
3.399
+0.074
2.22%
1 jan 1994 ano
3.483
+0.084
2.48%
1 jan 1995 ano
3.332
-0.152
-4.36%
1 jan 1996 ano
3.406
+0.075
2.25%
1 jan 1997 ano
3.417
+0.011
0.32%
1 jan 1998 ano
3.352
-0.066
-1.92%
1 jan 1999 ano
3.222
-0.129
-3.86%
1 jan 2000 ano
3.132
-0.09
-2.8%
1 jan 2001 ano
3.158
+0.026
0.83%
1 jan 2002 ano
3.179
+0.021
0.65%
1 jan 2003 ano
3.193
+0.014
0.45%
1 jan 2004 ano
3.196
+0.003
0.1%
1 jan 2005 ano
3.059
-0.137
-4.29%
1 jan 2006 ano
3.059
-0.001
-0.02%
1 jan 2007 ano
3.069
+0.011
0.35%
1 jan 2008 ano
3.06
-0.009
-0.29%
1 jan 2009 ano
3.066
+0.005
0.18%
1 jan 2010 ano
3.181
+0.116
3.77%
1 jan 2011 ano
3.309
+0.127
4.0%
1 jan 2012 ano
3.375
+0.066
2.0%
1 jan 2013 ano
3.396
+0.021
0.61%
1 jan 2014 ano
3.435
+0.039
1.15%
Classificação de países por estatísticas atuais por anos


Comentários: