29
/pt/
pt
AIzaSyAYiBZKx7MnpbEhh9jyipgxe19OcubqV5w
April 1, 2024
100918
Canada
CAN
true
2
1
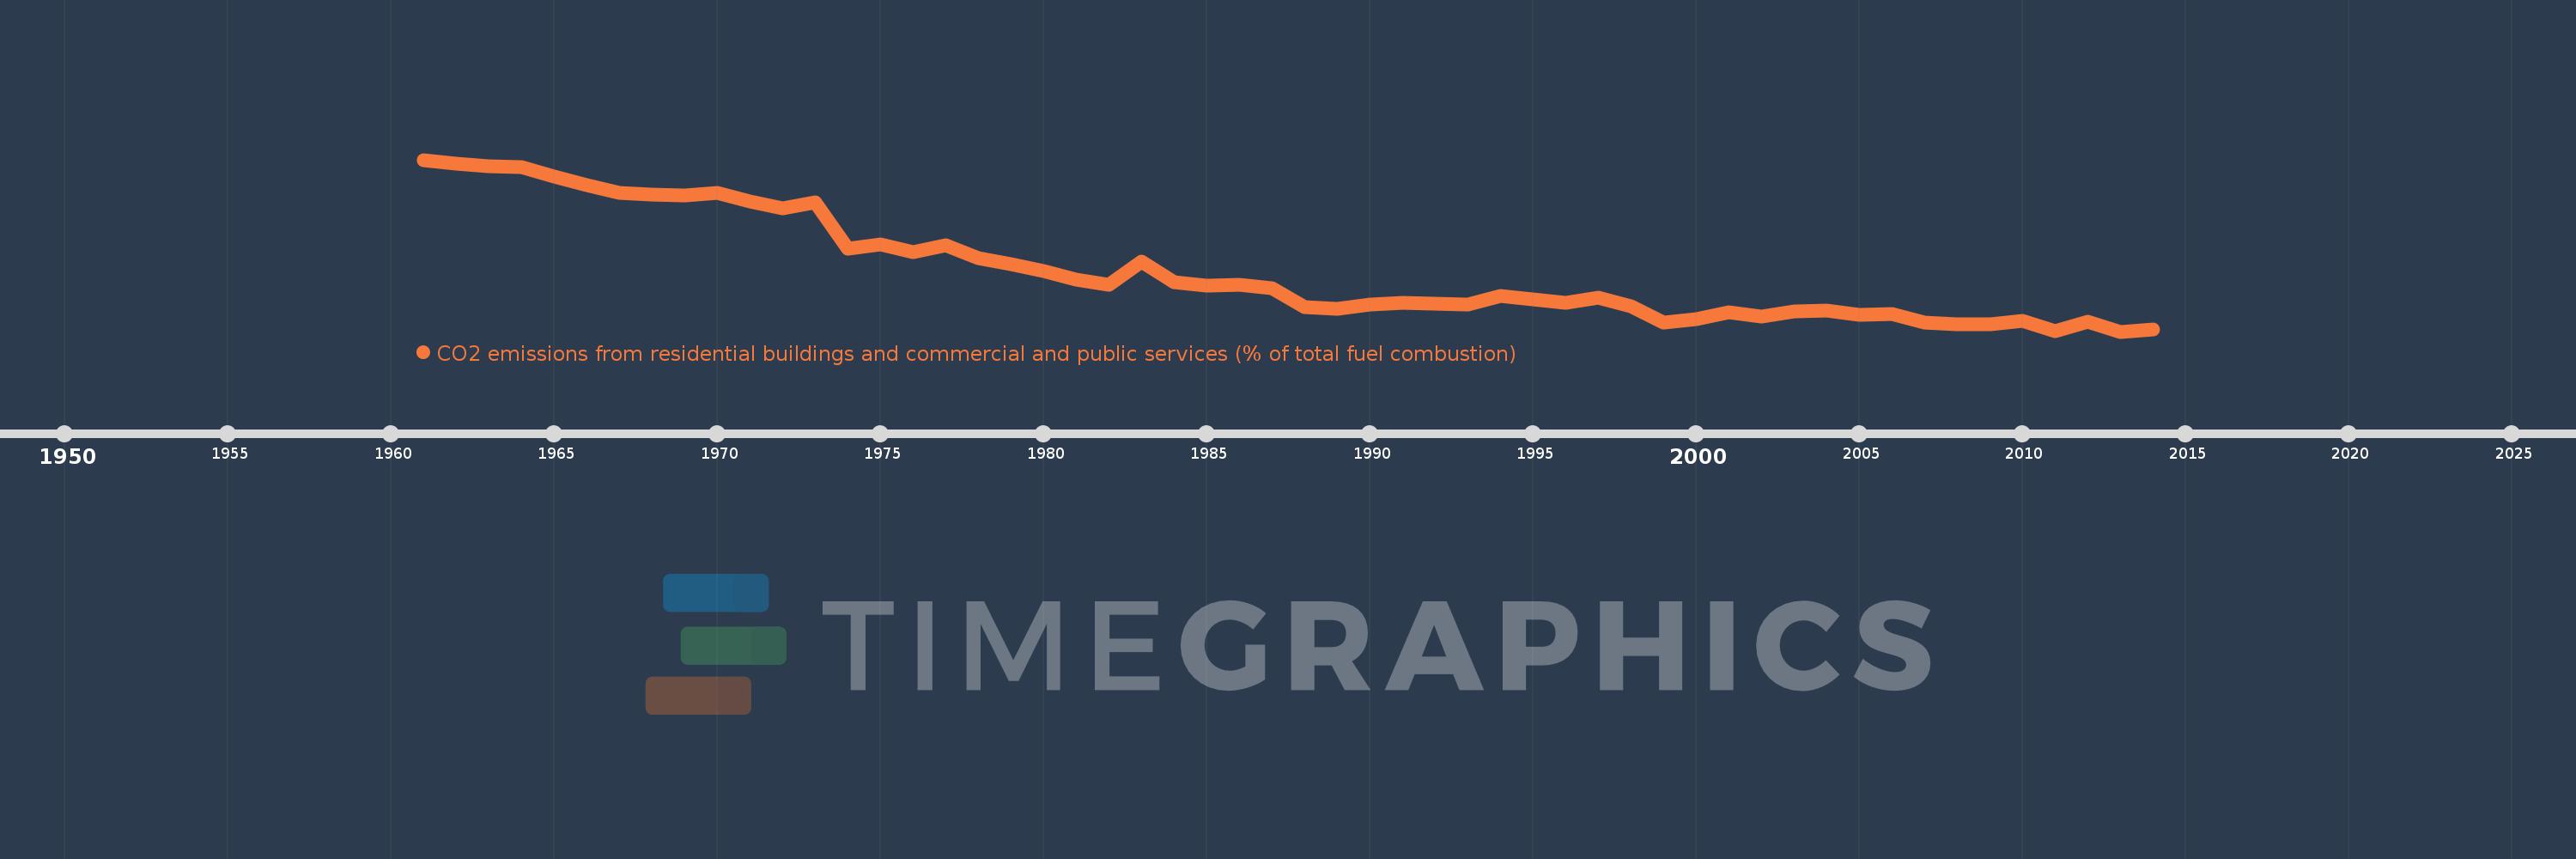
CO2 emissions from residential buildings and commercial and public services (% of total fuel combustion)
2014,2013,2012,2011,2010,2009,2008,2007,2006,2005,2004,2003,2002,2001,2000,1999,1998,1997,1996,1995,1994,1993,1992,1991,1990,1989,1988,1987,1986,1985,1984,1983,1982,1981,1980,1979,1978,1977,1976,1975,1974,1973,1972,1971,1970,1969,1968,1967,1966,1965,1964,1963,1962,1961
Estas estatísticas em outros países:
AlbaniaAlgeriaAngolaArab WorldArgentinaArmeniaAustraliaAustriaAzerbaijanBahrainBangladeshBelarusBelgiumBeninBoliviaBosnia and HerzegovinaBotswanaBrazilBrunei DarussalamBulgariaCambodiaCameroonCanadaCaribbean small statesCentral Europe and the BalticsChileChinaColombiaCongo, Dem. Rep.Congo, Rep.Costa RicaCote d'IvoireCroatiaCubaCuracaoCyprusCzech RepublicDenmarkDominican RepublicEarly-demographic dividendEast Asia & PacificEast Asia & Pacific (excluding high income)East Asia & Pacific (IDA & IBRD countries)EcuadorEgypt, Arab Rep.El SalvadorEritreaEstoniaEthiopiaEuro areaEurope & Central AsiaEurope & Central Asia (excluding high income)Europe & Central Asia (IDA & IBRD countries)European UnionFinlandFragile and conflict affected situationsFranceGabonGeorgiaGermanyGhanaGibraltarGreeceGuatemalaHaitiHeavily indebted poor countries (HIPC)High incomeHondurasHong Kong SAR, ChinaHungaryIBRD onlyIcelandIDA & IBRD totalIDA blendIDA onlyIDA totalIndiaIndonesiaIran, Islamic Rep.IraqIrelandIsraelItalyJamaicaJapanJordanKazakhstanKenyaKorea, Dem. People’s Rep.Korea, Rep.KosovoKuwaitKyrgyz RepublicLate-demographic dividendLatin America & Caribbean Latin America & Caribbean (excluding high income)Latin America & the Caribbean (IDA & IBRD countries)LatviaLeast developed countries: UN classificationLebanonLibyaLithuaniaLow & middle incomeLow incomeLower middle incomeLuxembourgMacedonia, FYRMalaysiaMaltaMauritiusMexicoMiddle East & North AfricaMiddle East & North Africa (excluding high income)Middle East & North Africa (IDA & IBRD countries)Middle incomeMoldovaMongoliaMontenegroMoroccoMozambiqueMyanmarNamibiaNepalNetherlandsNew ZealandNicaraguaNigerNigeriaNorth AmericaNorwayOECD membersOmanOther small statesPakistanPanamaParaguayPeruPhilippinesPolandPortugalPost-demographic dividendPre-demographic dividendQatarRomaniaRussian FederationSaudi ArabiaSenegalSerbiaSingaporeSlovak RepublicSloveniaSmall statesSouth AfricaSouth AsiaSouth Asia (IDA & IBRD)South SudanSpainSri LankaSub-Saharan Africa Sub-Saharan Africa (excluding high income)Sub-Saharan Africa (IDA & IBRD countries)SudanSwedenSwitzerlandSyrian Arab RepublicTajikistanTanzaniaThailandTogoTrinidad and TobagoTunisiaTurkeyTurkmenistanUkraineUnited Arab EmiratesUnited KingdomUnited StatesUpper middle incomeUruguayUzbekistanVenezuela, RBVietnamWorldYemen, Rep.ZambiaZimbabwe Linha do tempo:
Nesta escala de tempo está apresentado um gráfico de 1961 ano até 2014 ano Canada. Dados de 1960 ano ausente. O número de observações reais por data: 54.
Fonte (nome):
Indicadores de desenvolvimento mundial
Fonte (organização):
IEA Statistics © OECD/IEA 2014 (http://www.iea.org/stats/index.asp), subject to https://www.iea.org/t&c/termsandconditions/
Categorias:
Environment
Foi atualizado:
23 abr 2017 ano
Indicadores de alterações dos valores ao longo dos anos
Mínimo:
14.254
1 jan 2013 ano
Máximo:
33.307
1 jan 1961 ano
Na data de observação
Valor
Mudança absoluta
A alteração em relação ao valor anterior
1 jan 1961 ano
33.307
+33.307
0.0%
1 jan 1962 ano
32.908
-0.398
-1.2%
1 jan 1963 ano
32.562
-0.347
-1.05%
1 jan 1964 ano
32.489
-0.073
-0.22%
1 jan 1965 ano
31.479
-1.009
-3.11%
1 jan 1966 ano
30.461
-1.019
-3.24%
1 jan 1967 ano
29.597
-0.864
-2.84%
1 jan 1968 ano
29.451
-0.146
-0.49%
1 jan 1969 ano
29.382
-0.068
-0.23%
1 jan 1970 ano
29.624
+0.242
0.82%
1 jan 1971 ano
28.691
-0.934
-3.15%
1 jan 1972 ano
27.938
-0.753
-2.62%
1 jan 1973 ano
28.55
+0.612
2.19%
1 jan 1974 ano
23.45
-5.1
-17.86%
1 jan 1975 ano
23.896
+0.446
1.9%
1 jan 1976 ano
23.064
-0.831
-3.48%
1 jan 1977 ano
23.822
+0.757
3.28%
1 jan 1978 ano
22.44
-1.382
-5.8%
1 jan 1979 ano
21.698
-0.742
-3.31%
1 jan 1980 ano
20.963
-0.735
-3.39%
1 jan 1981 ano
20.011
-0.952
-4.54%
1 jan 1982 ano
19.474
-0.537
-2.68%
1 jan 1983 ano
21.972
+2.497
12.82%
1 jan 1984 ano
19.701
-2.271
-10.33%
1 jan 1985 ano
19.351
-0.35
-1.78%
1 jan 1986 ano
19.448
+0.098
0.5%
1 jan 1987 ano
19.065
-0.383
-1.97%
1 jan 1988 ano
16.979
-2.086
-10.94%
1 jan 1989 ano
16.758
-0.221
-1.3%
1 jan 1990 ano
17.231
+0.473
2.82%
1 jan 1991 ano
17.453
+0.222
1.29%
1 jan 1992 ano
17.368
-0.085
-0.48%
1 jan 1993 ano
17.278
-0.09
-0.52%
1 jan 1994 ano
18.223
+0.945
5.47%
1 jan 1995 ano
17.851
-0.372
-2.04%
1 jan 1996 ano
17.403
-0.448
-2.51%
1 jan 1997 ano
18.003
+0.599
3.44%
1 jan 1998 ano
17.042
-0.96
-5.33%
1 jan 1999 ano
15.232
-1.81
-10.62%
1 jan 2000 ano
15.677
+0.445
2.92%
1 jan 2001 ano
16.411
+0.734
4.68%
1 jan 2002 ano
15.948
-0.463
-2.82%
1 jan 2003 ano
16.46
+0.512
3.21%
1 jan 2004 ano
16.573
+0.113
0.69%
1 jan 2005 ano
16.127
-0.447
-2.69%
1 jan 2006 ano
16.208
+0.082
0.51%
1 jan 2007 ano
15.289
-0.919
-5.67%
1 jan 2008 ano
15.04
-0.249
-1.63%
1 jan 2009 ano
15.051
+0.011
0.08%
1 jan 2010 ano
15.463
+0.412
2.74%
1 jan 2011 ano
14.318
-1.145
-7.41%
1 jan 2012 ano
15.371
+1.053
7.36%
1 jan 2013 ano
14.254
-1.117
-7.27%
1 jan 2014 ano
14.516
+0.262
1.84%
Classificação de países por estatísticas atuais por anos


Comentários: