29
/pt/
pt
AIzaSyAYiBZKx7MnpbEhh9jyipgxe19OcubqV5w
April 1, 2024
161283
Italy
ITA
true
2
1
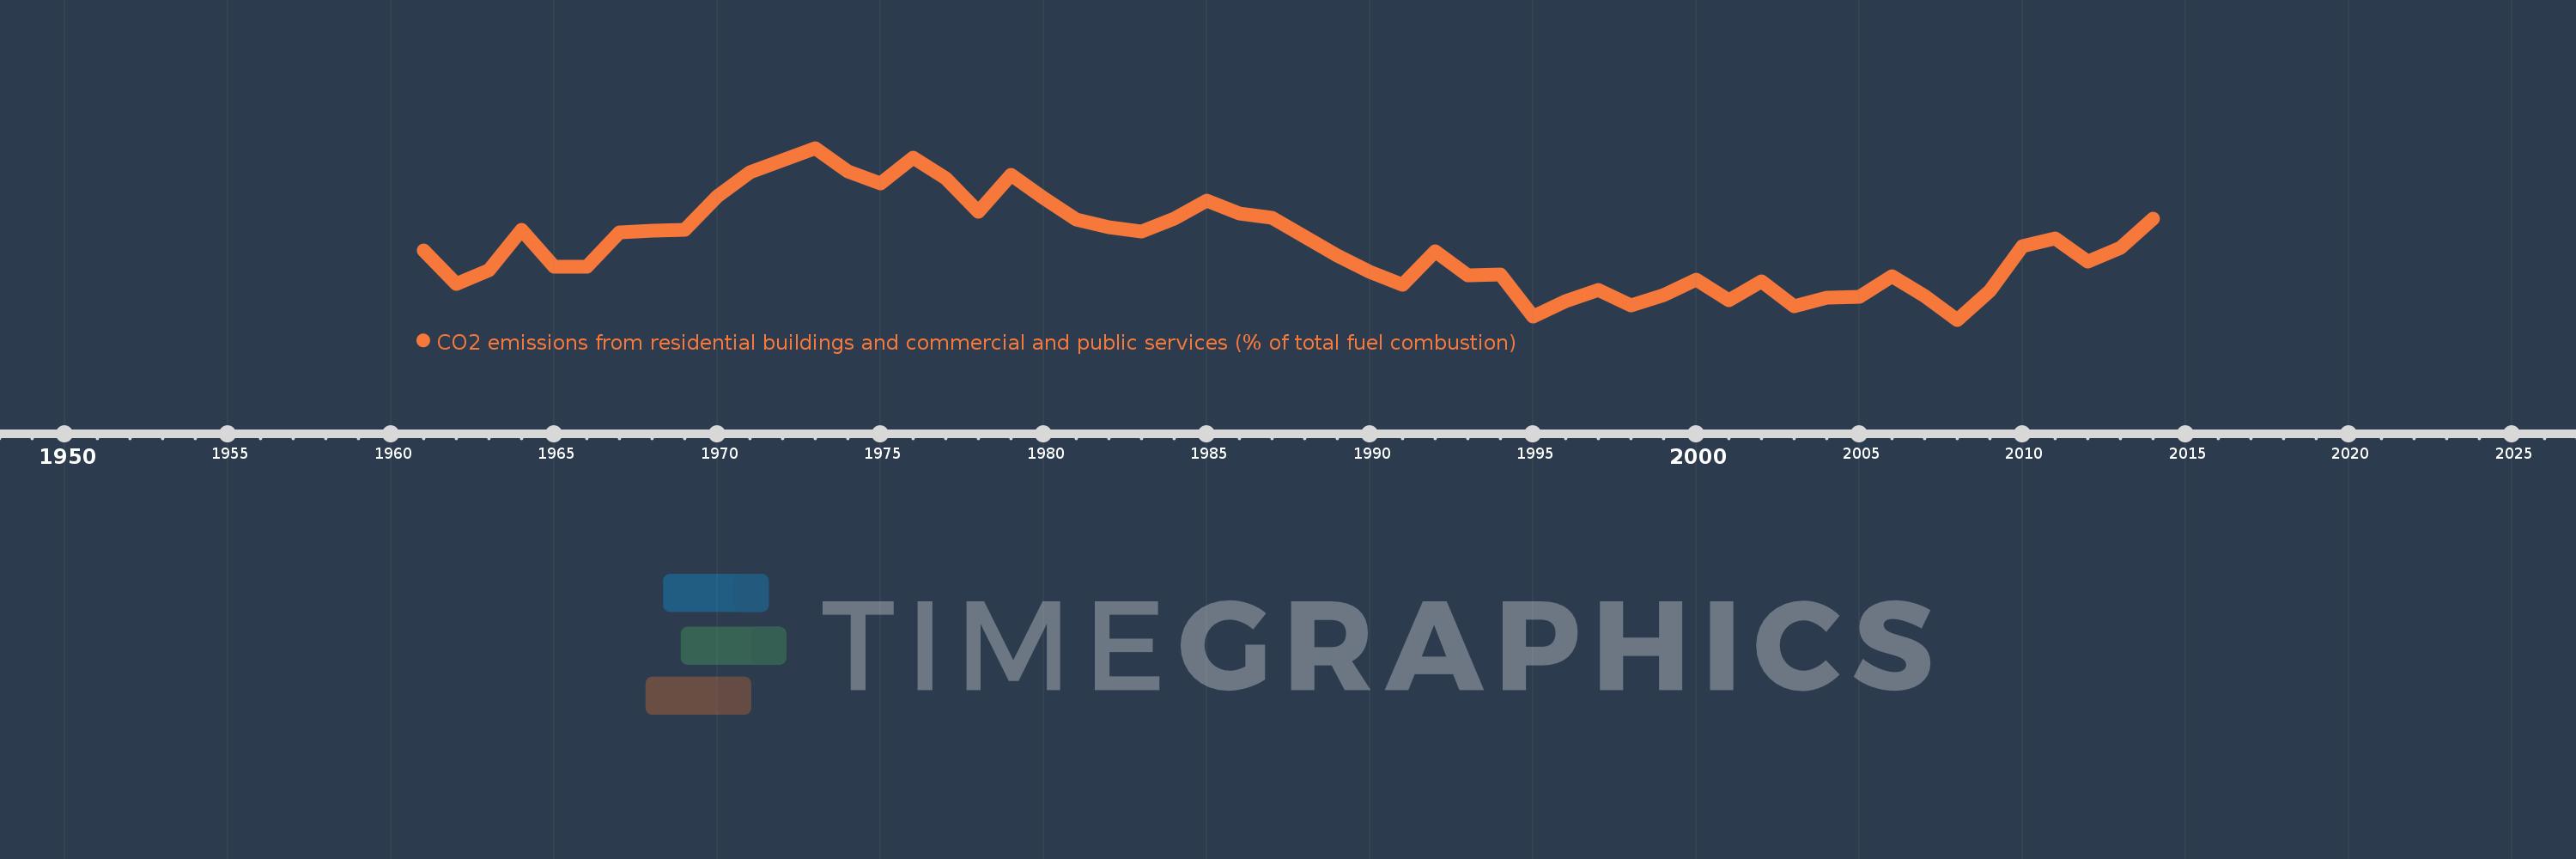
CO2 emissions from residential buildings and commercial and public services (% of total fuel combustion)
2014,2013,2012,2011,2010,2009,2008,2007,2006,2005,2004,2003,2002,2001,2000,1999,1998,1997,1996,1995,1994,1993,1992,1991,1990,1989,1988,1987,1986,1985,1984,1983,1982,1981,1980,1979,1978,1977,1976,1975,1974,1973,1972,1971,1970,1969,1968,1967,1966,1965,1964,1963,1962,1961
Estas estatísticas em outros países:
AlbaniaAlgeriaAngolaArab WorldArgentinaArmeniaAustraliaAustriaAzerbaijanBahrainBangladeshBelarusBelgiumBeninBoliviaBosnia and HerzegovinaBotswanaBrazilBrunei DarussalamBulgariaCambodiaCameroonCanadaCaribbean small statesCentral Europe and the BalticsChileChinaColombiaCongo, Dem. Rep.Congo, Rep.Costa RicaCote d'IvoireCroatiaCubaCuracaoCyprusCzech RepublicDenmarkDominican RepublicEarly-demographic dividendEast Asia & PacificEast Asia & Pacific (excluding high income)East Asia & Pacific (IDA & IBRD countries)EcuadorEgypt, Arab Rep.El SalvadorEritreaEstoniaEthiopiaEuro areaEurope & Central AsiaEurope & Central Asia (excluding high income)Europe & Central Asia (IDA & IBRD countries)European UnionFinlandFragile and conflict affected situationsFranceGabonGeorgiaGermanyGhanaGibraltarGreeceGuatemalaHaitiHeavily indebted poor countries (HIPC)High incomeHondurasHong Kong SAR, ChinaHungaryIBRD onlyIcelandIDA & IBRD totalIDA blendIDA onlyIDA totalIndiaIndonesiaIran, Islamic Rep.IraqIrelandIsraelItalyJamaicaJapanJordanKazakhstanKenyaKorea, Dem. People’s Rep.Korea, Rep.KosovoKuwaitKyrgyz RepublicLate-demographic dividendLatin America & Caribbean Latin America & Caribbean (excluding high income)Latin America & the Caribbean (IDA & IBRD countries)LatviaLeast developed countries: UN classificationLebanonLibyaLithuaniaLow & middle incomeLow incomeLower middle incomeLuxembourgMacedonia, FYRMalaysiaMaltaMauritiusMexicoMiddle East & North AfricaMiddle East & North Africa (excluding high income)Middle East & North Africa (IDA & IBRD countries)Middle incomeMoldovaMongoliaMontenegroMoroccoMozambiqueMyanmarNamibiaNepalNetherlandsNew ZealandNicaraguaNigerNigeriaNorth AmericaNorwayOECD membersOmanOther small statesPakistanPanamaParaguayPeruPhilippinesPolandPortugalPost-demographic dividendPre-demographic dividendQatarRomaniaRussian FederationSaudi ArabiaSenegalSerbiaSingaporeSlovak RepublicSloveniaSmall statesSouth AfricaSouth AsiaSouth Asia (IDA & IBRD)South SudanSpainSri LankaSub-Saharan Africa Sub-Saharan Africa (excluding high income)Sub-Saharan Africa (IDA & IBRD countries)SudanSwedenSwitzerlandSyrian Arab RepublicTajikistanTanzaniaThailandTogoTrinidad and TobagoTunisiaTurkeyTurkmenistanUkraineUnited Arab EmiratesUnited KingdomUnited StatesUpper middle incomeUruguayUzbekistanVenezuela, RBVietnamWorldYemen, Rep.ZambiaZimbabwe Linha do tempo:
Nesta escala de tempo está apresentado um gráfico de 1961 ano até 2014 ano Italy. Dados de 1960 ano ausente. O número de observações reais por data: 54.
Fonte (nome):
Indicadores de desenvolvimento mundial
Fonte (organização):
IEA Statistics © OECD/IEA 2014 (http://www.iea.org/stats/index.asp), subject to https://www.iea.org/t&c/termsandconditions/
Categorias:
Environment
Foi atualizado:
23 abr 2017 ano
Indicadores de alterações dos valores ao longo dos anos
Mínimo:
15.5
1 jan 2008 ano
Máximo:
23.803
1 jan 1973 ano
Na data de observação
Valor
Mudança absoluta
A alteração em relação ao valor anterior
1 jan 1961 ano
18.843
+18.843
0.0%
1 jan 1962 ano
17.219
-1.624
-8.62%
1 jan 1963 ano
17.899
+0.68
3.95%
1 jan 1964 ano
19.846
+1.948
10.88%
1 jan 1965 ano
18.08
-1.766
-8.9%
1 jan 1966 ano
18.047
-0.033
-0.18%
1 jan 1967 ano
19.717
+1.67
9.26%
1 jan 1968 ano
19.809
+0.092
0.46%
1 jan 1969 ano
19.84
+0.031
0.16%
1 jan 1970 ano
21.476
+1.637
8.25%
1 jan 1971 ano
22.614
+1.138
5.3%
1 jan 1972 ano
23.201
+0.587
2.6%
1 jan 1973 ano
23.803
+0.602
2.6%
1 jan 1974 ano
22.686
-1.117
-4.69%
1 jan 1975 ano
22.097
-0.589
-2.59%
1 jan 1976 ano
23.317
+1.22
5.52%
1 jan 1977 ano
22.34
-0.977
-4.19%
1 jan 1978 ano
20.709
-1.632
-7.3%
1 jan 1979 ano
22.514
+1.805
8.72%
1 jan 1980 ano
21.382
-1.132
-5.03%
1 jan 1981 ano
20.365
-1.017
-4.76%
1 jan 1982 ano
19.964
-0.401
-1.97%
1 jan 1983 ano
19.743
-0.22
-1.1%
1 jan 1984 ano
20.391
+0.648
3.28%
1 jan 1985 ano
21.242
+0.851
4.17%
1 jan 1986 ano
20.653
-0.589
-2.77%
1 jan 1987 ano
20.418
-0.235
-1.14%
1 jan 1988 ano
19.518
-0.901
-4.41%
1 jan 1989 ano
18.587
-0.931
-4.77%
1 jan 1990 ano
17.828
-0.759
-4.09%
1 jan 1991 ano
17.198
-0.63
-3.53%
1 jan 1992 ano
18.812
+1.614
9.39%
1 jan 1993 ano
17.66
-1.152
-6.12%
1 jan 1994 ano
17.701
+0.041
0.23%
1 jan 1995 ano
15.646
-2.056
-11.61%
1 jan 1996 ano
16.397
+0.752
4.8%
1 jan 1997 ano
16.956
+0.558
3.4%
1 jan 1998 ano
16.201
-0.755
-4.45%
1 jan 1999 ano
16.684
+0.484
2.98%
1 jan 2000 ano
17.459
+0.775
4.65%
1 jan 2001 ano
16.457
-1.002
-5.74%
1 jan 2002 ano
17.357
+0.9
5.47%
1 jan 2003 ano
16.142
-1.215
-7.0%
1 jan 2004 ano
16.55
+0.408
2.53%
1 jan 2005 ano
16.604
+0.054
0.33%
1 jan 2006 ano
17.595
+0.99
5.97%
1 jan 2007 ano
16.633
-0.962
-5.47%
1 jan 2008 ano
15.5
-1.133
-6.81%
1 jan 2009 ano
16.89
+1.39
8.97%
1 jan 2010 ano
19.073
+2.183
12.92%
1 jan 2011 ano
19.42
+0.348
1.82%
1 jan 2012 ano
18.32
-1.101
-5.67%
1 jan 2013 ano
18.962
+0.643
3.51%
1 jan 2014 ano
20.407
+1.445
7.62%
Classificação de países por estatísticas atuais por anos


Comentários: