29
/pt/
pt
AIzaSyAYiBZKx7MnpbEhh9jyipgxe19OcubqV5w
April 1, 2024
252804
Sudan
SDN
true
2
1
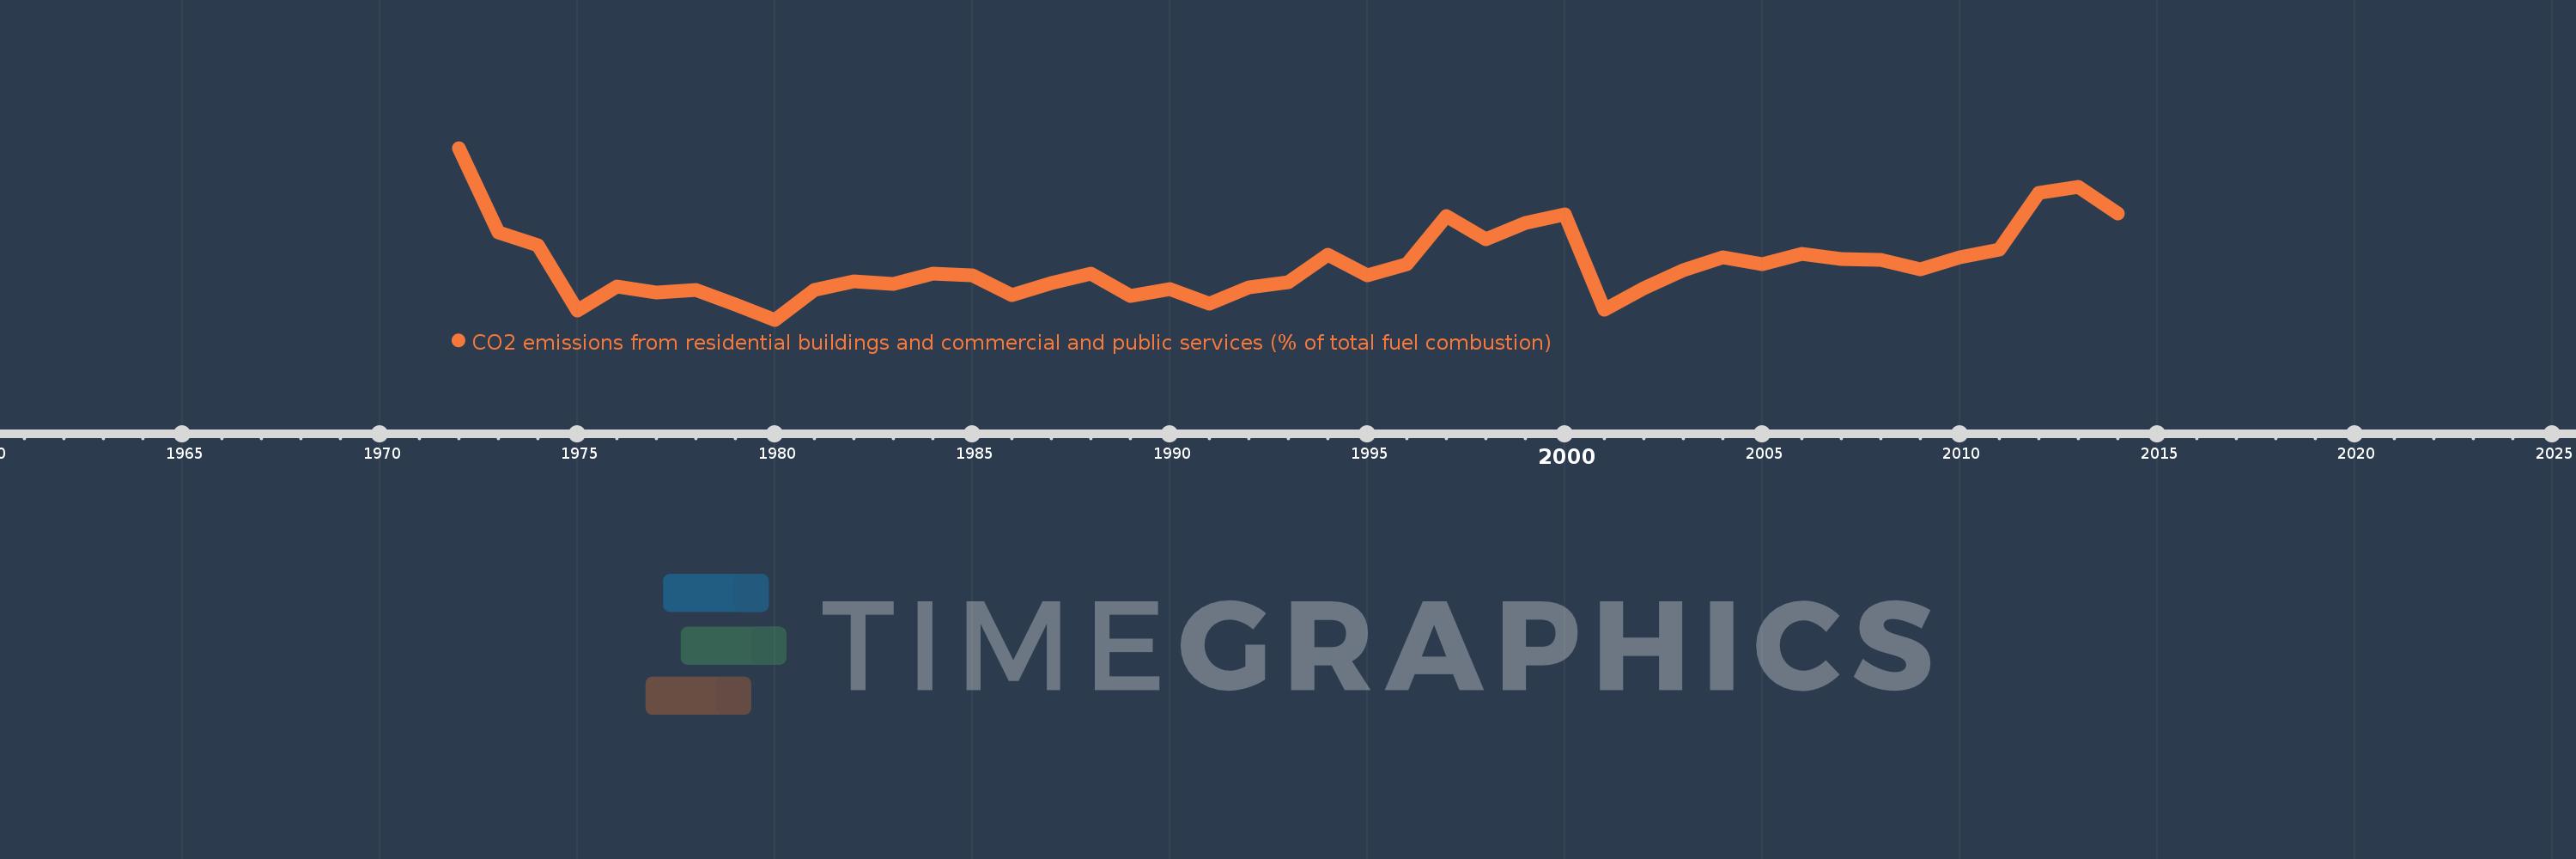
CO2 emissions from residential buildings and commercial and public services (% of total fuel combustion)
2014,2013,2012,2011,2010,2009,2008,2007,2006,2005,2004,2003,2002,2001,2000,1999,1998,1997,1996,1995,1994,1993,1992,1991,1990,1989,1988,1987,1986,1985,1984,1983,1982,1981,1980,1979,1978,1977,1976,1975,1974,1973,1972
Estas estatísticas em outros países:
AlbaniaAlgeriaAngolaArab WorldArgentinaArmeniaAustraliaAustriaAzerbaijanBahrainBangladeshBelarusBelgiumBeninBoliviaBosnia and HerzegovinaBotswanaBrazilBrunei DarussalamBulgariaCambodiaCameroonCanadaCaribbean small statesCentral Europe and the BalticsChileChinaColombiaCongo, Dem. Rep.Congo, Rep.Costa RicaCote d'IvoireCroatiaCubaCuracaoCyprusCzech RepublicDenmarkDominican RepublicEarly-demographic dividendEast Asia & PacificEast Asia & Pacific (excluding high income)East Asia & Pacific (IDA & IBRD countries)EcuadorEgypt, Arab Rep.El SalvadorEritreaEstoniaEthiopiaEuro areaEurope & Central AsiaEurope & Central Asia (excluding high income)Europe & Central Asia (IDA & IBRD countries)European UnionFinlandFragile and conflict affected situationsFranceGabonGeorgiaGermanyGhanaGibraltarGreeceGuatemalaHaitiHeavily indebted poor countries (HIPC)High incomeHondurasHong Kong SAR, ChinaHungaryIBRD onlyIcelandIDA & IBRD totalIDA blendIDA onlyIDA totalIndiaIndonesiaIran, Islamic Rep.IraqIrelandIsraelItalyJamaicaJapanJordanKazakhstanKenyaKorea, Dem. People’s Rep.Korea, Rep.KosovoKuwaitKyrgyz RepublicLate-demographic dividendLatin America & Caribbean Latin America & Caribbean (excluding high income)Latin America & the Caribbean (IDA & IBRD countries)LatviaLeast developed countries: UN classificationLebanonLibyaLithuaniaLow & middle incomeLow incomeLower middle incomeLuxembourgMacedonia, FYRMalaysiaMaltaMauritiusMexicoMiddle East & North AfricaMiddle East & North Africa (excluding high income)Middle East & North Africa (IDA & IBRD countries)Middle incomeMoldovaMongoliaMontenegroMoroccoMozambiqueMyanmarNamibiaNepalNetherlandsNew ZealandNicaraguaNigerNigeriaNorth AmericaNorwayOECD membersOmanOther small statesPakistanPanamaParaguayPeruPhilippinesPolandPortugalPost-demographic dividendPre-demographic dividendQatarRomaniaRussian FederationSaudi ArabiaSenegalSerbiaSingaporeSlovak RepublicSloveniaSmall statesSouth AfricaSouth AsiaSouth Asia (IDA & IBRD)South SudanSpainSri LankaSub-Saharan Africa Sub-Saharan Africa (excluding high income)Sub-Saharan Africa (IDA & IBRD countries)SudanSwedenSwitzerlandSyrian Arab RepublicTajikistanTanzaniaThailandTogoTrinidad and TobagoTunisiaTurkeyTurkmenistanUkraineUnited Arab EmiratesUnited KingdomUnited StatesUpper middle incomeUruguayUzbekistanVenezuela, RBVietnamWorldYemen, Rep.ZambiaZimbabwe Linha do tempo:
Nesta escala de tempo está apresentado um gráfico de 1972 ano até 2014 ano Sudan. Dados de 1971 ano ausente. O número de observações reais por data: 43.
Fonte (nome):
Indicadores de desenvolvimento mundial
Fonte (organização):
IEA Statistics © OECD/IEA 2014 (http://www.iea.org/stats/index.asp), subject to https://www.iea.org/t&c/termsandconditions/
Categorias:
Environment
Foi atualizado:
23 abr 2017 ano
Indicadores de alterações dos valores ao longo dos anos
Mínimo:
1.911
1 jan 1980 ano
Máximo:
9.657
1 jan 1972 ano
Na data de observação
Valor
Mudança absoluta
A alteração em relação ao valor anterior
1 jan 1972 ano
9.657
+9.657
0.0%
1 jan 1973 ano
5.865
-3.792
-39.27%
1 jan 1974 ano
5.286
-0.579
-9.87%
1 jan 1975 ano
2.342
-2.944
-55.7%
1 jan 1976 ano
3.427
+1.085
46.32%
1 jan 1977 ano
3.135
-0.292
-8.52%
1 jan 1978 ano
3.245
+0.11
3.51%
1 jan 1979 ano
2.597
-0.647
-19.95%
1 jan 1980 ano
1.911
-0.687
-26.43%
1 jan 1981 ano
3.27
+1.359
71.12%
1 jan 1982 ano
3.631
+0.362
11.06%
1 jan 1983 ano
3.533
-0.099
-2.72%
1 jan 1984 ano
4.0
+0.467
13.23%
1 jan 1985 ano
3.904
-0.096
-2.4%
1 jan 1986 ano
3.015
-0.889
-22.77%
1 jan 1987 ano
3.571
+0.556
18.45%
1 jan 1988 ano
4.0
+0.429
12.0%
1 jan 1989 ano
2.968
-1.032
-25.8%
1 jan 1990 ano
3.291
+0.323
10.89%
1 jan 1991 ano
2.647
-0.645
-19.59%
1 jan 1992 ano
3.383
+0.736
27.82%
1 jan 1993 ano
3.612
+0.229
6.77%
1 jan 1994 ano
4.854
+1.243
34.41%
1 jan 1995 ano
3.922
-0.933
-19.22%
1 jan 1996 ano
4.408
+0.487
12.41%
1 jan 1997 ano
6.585
+2.177
49.38%
1 jan 1998 ano
5.523
-1.063
-16.14%
1 jan 1999 ano
6.277
+0.754
13.66%
1 jan 2000 ano
6.68
+0.403
6.42%
1 jan 2001 ano
2.372
-4.308
-64.49%
1 jan 2002 ano
3.322
+0.95
40.05%
1 jan 2003 ano
4.155
+0.833
25.08%
1 jan 2004 ano
4.712
+0.557
13.39%
1 jan 2005 ano
4.41
-0.302
-6.41%
1 jan 2006 ano
4.868
+0.458
10.39%
1 jan 2007 ano
4.63
-0.238
-4.88%
1 jan 2008 ano
4.604
-0.027
-0.57%
1 jan 2009 ano
4.184
-0.42
-9.12%
1 jan 2010 ano
4.71
+0.526
12.57%
1 jan 2011 ano
5.077
+0.367
7.79%
1 jan 2012 ano
7.627
+2.55
50.22%
1 jan 2013 ano
7.906
+0.28
3.67%
1 jan 2014 ano
6.701
-1.205
-15.24%
Classificação de países por estatísticas atuais por anos


Comentários: