29
/pt/
pt
AIzaSyAYiBZKx7MnpbEhh9jyipgxe19OcubqV5w
April 1, 2024
215085
Oman
OMN
true
2
1
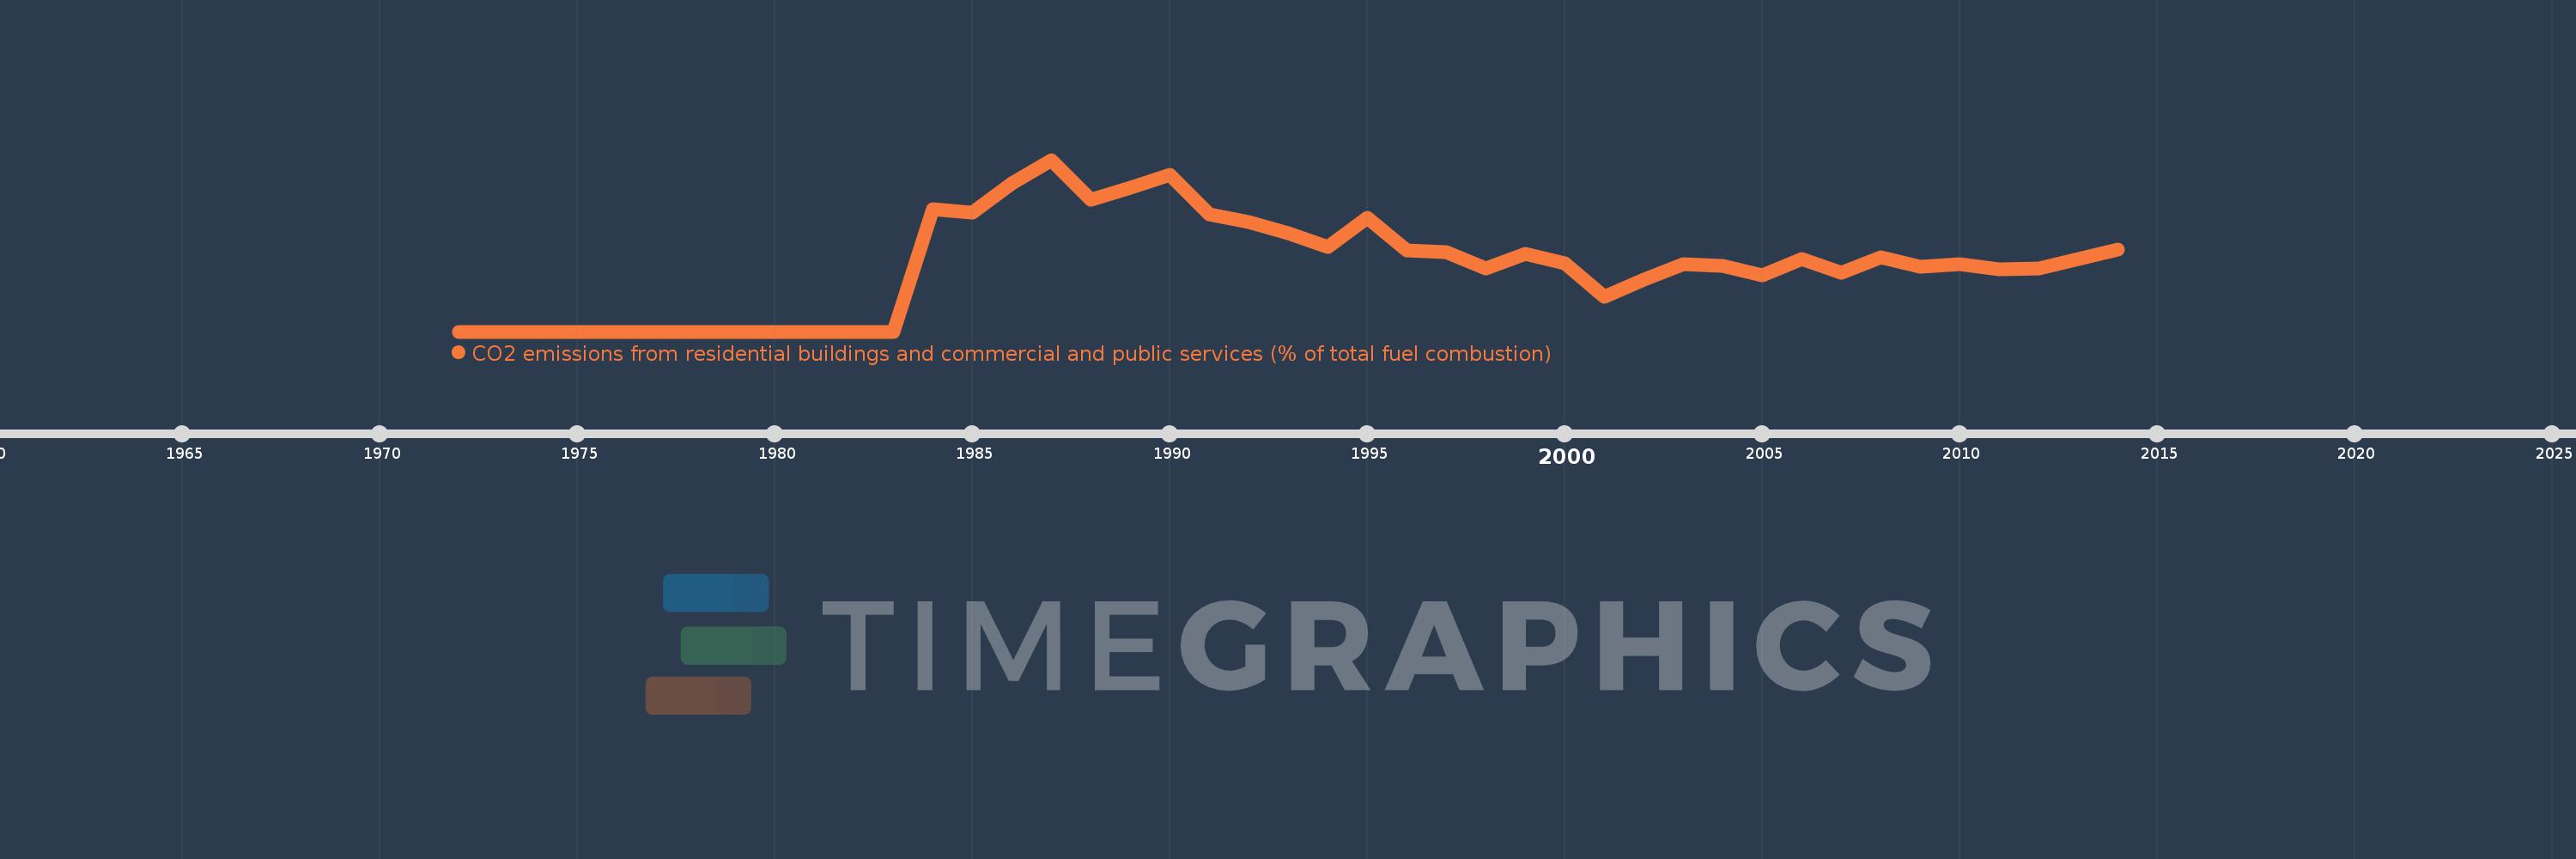
CO2 emissions from residential buildings and commercial and public services (% of total fuel combustion)
2014,2013,2012,2011,2010,2009,2008,2007,2006,2005,2004,2003,2002,2001,2000,1999,1998,1997,1996,1995,1994,1993,1992,1991,1990,1989,1988,1987,1986,1985,1984,1983,1982,1981,1980,1979,1978,1977,1976,1975,1974,1973,1972
Estas estatísticas em outros países:
AlbaniaAlgeriaAngolaArab WorldArgentinaArmeniaAustraliaAustriaAzerbaijanBahrainBangladeshBelarusBelgiumBeninBoliviaBosnia and HerzegovinaBotswanaBrazilBrunei DarussalamBulgariaCambodiaCameroonCanadaCaribbean small statesCentral Europe and the BalticsChileChinaColombiaCongo, Dem. Rep.Congo, Rep.Costa RicaCote d'IvoireCroatiaCubaCuracaoCyprusCzech RepublicDenmarkDominican RepublicEarly-demographic dividendEast Asia & PacificEast Asia & Pacific (excluding high income)East Asia & Pacific (IDA & IBRD countries)EcuadorEgypt, Arab Rep.El SalvadorEritreaEstoniaEthiopiaEuro areaEurope & Central AsiaEurope & Central Asia (excluding high income)Europe & Central Asia (IDA & IBRD countries)European UnionFinlandFragile and conflict affected situationsFranceGabonGeorgiaGermanyGhanaGibraltarGreeceGuatemalaHaitiHeavily indebted poor countries (HIPC)High incomeHondurasHong Kong SAR, ChinaHungaryIBRD onlyIcelandIDA & IBRD totalIDA blendIDA onlyIDA totalIndiaIndonesiaIran, Islamic Rep.IraqIrelandIsraelItalyJamaicaJapanJordanKazakhstanKenyaKorea, Dem. People’s Rep.Korea, Rep.KosovoKuwaitKyrgyz RepublicLate-demographic dividendLatin America & Caribbean Latin America & Caribbean (excluding high income)Latin America & the Caribbean (IDA & IBRD countries)LatviaLeast developed countries: UN classificationLebanonLibyaLithuaniaLow & middle incomeLow incomeLower middle incomeLuxembourgMacedonia, FYRMalaysiaMaltaMauritiusMexicoMiddle East & North AfricaMiddle East & North Africa (excluding high income)Middle East & North Africa (IDA & IBRD countries)Middle incomeMoldovaMongoliaMontenegroMoroccoMozambiqueMyanmarNamibiaNepalNetherlandsNew ZealandNicaraguaNigerNigeriaNorth AmericaNorwayOECD membersOmanOther small statesPakistanPanamaParaguayPeruPhilippinesPolandPortugalPost-demographic dividendPre-demographic dividendQatarRomaniaRussian FederationSaudi ArabiaSenegalSerbiaSingaporeSlovak RepublicSloveniaSmall statesSouth AfricaSouth AsiaSouth Asia (IDA & IBRD)South SudanSpainSri LankaSub-Saharan Africa Sub-Saharan Africa (excluding high income)Sub-Saharan Africa (IDA & IBRD countries)SudanSwedenSwitzerlandSyrian Arab RepublicTajikistanTanzaniaThailandTogoTrinidad and TobagoTunisiaTurkeyTurkmenistanUkraineUnited Arab EmiratesUnited KingdomUnited StatesUpper middle incomeUruguayUzbekistanVenezuela, RBVietnamWorldYemen, Rep.ZambiaZimbabwe Linha do tempo:
Nesta escala de tempo está apresentado um gráfico de 1972 ano até 2014 ano Oman. Dados de 1971 ano ausente. O número de observações reais por data: 43.
Fonte (nome):
Indicadores de desenvolvimento mundial
Fonte (organização):
IEA Statistics © OECD/IEA 2014 (http://www.iea.org/stats/index.asp), subject to https://www.iea.org/t&c/termsandconditions/
Categorias:
Environment
Foi atualizado:
23 abr 2017 ano
Indicadores de alterações dos valores ao longo dos anos
Máximo:
1.445
1 jan 1987 ano
Na data de observação
Valor
Mudança absoluta
A alteração em relação ao valor anterior
1 jan 1972 ano
0.0
0.0
0.0%
1 jan 1984 ano
1.028
+1.028
%
1 jan 1985 ano
1.004
-0.024
-2.36%
1 jan 1986 ano
1.243
+0.239
23.84%
1 jan 1987 ano
1.445
+0.201
16.19%
1 jan 1988 ano
1.109
-0.335
-23.21%
1 jan 1989 ano
1.207
+0.097
8.77%
1 jan 1990 ano
1.316
+0.109
9.05%
1 jan 1991 ano
0.984
-0.332
-25.2%
1 jan 1992 ano
0.922
-0.062
-6.33%
1 jan 1993 ano
0.824
-0.098
-10.63%
1 jan 1994 ano
0.715
-0.109
-13.17%
1 jan 1995 ano
0.96
+0.245
34.19%
1 jan 1996 ano
0.681
-0.279
-29.09%
1 jan 1997 ano
0.67
-0.011
-1.61%
1 jan 1998 ano
0.534
-0.136
-20.27%
1 jan 1999 ano
0.655
+0.121
22.63%
1 jan 2000 ano
0.572
-0.083
-12.64%
1 jan 2001 ano
0.294
-0.278
-48.59%
1 jan 2002 ano
0.435
+0.141
47.83%
1 jan 2003 ano
0.568
+0.133
30.58%
1 jan 2004 ano
0.55
-0.018
-3.1%
1 jan 2005 ano
0.476
-0.074
-13.44%
1 jan 2006 ano
0.608
+0.132
27.74%
1 jan 2007 ano
0.494
-0.114
-18.71%
1 jan 2008 ano
0.622
+0.128
25.79%
1 jan 2009 ano
0.546
-0.076
-12.28%
1 jan 2010 ano
0.565
+0.02
3.6%
1 jan 2011 ano
0.522
-0.043
-7.61%
1 jan 2012 ano
0.534
+0.012
2.23%
1 jan 2013 ano
0.608
+0.075
13.97%
1 jan 2014 ano
0.691
+0.082
13.5%
Classificação de países por estatísticas atuais por anos


Comentários: