29
/pt/
pt
AIzaSyAYiBZKx7MnpbEhh9jyipgxe19OcubqV5w
April 1, 2024
258107
Syrian Arab Republic
SYR
true
2
1
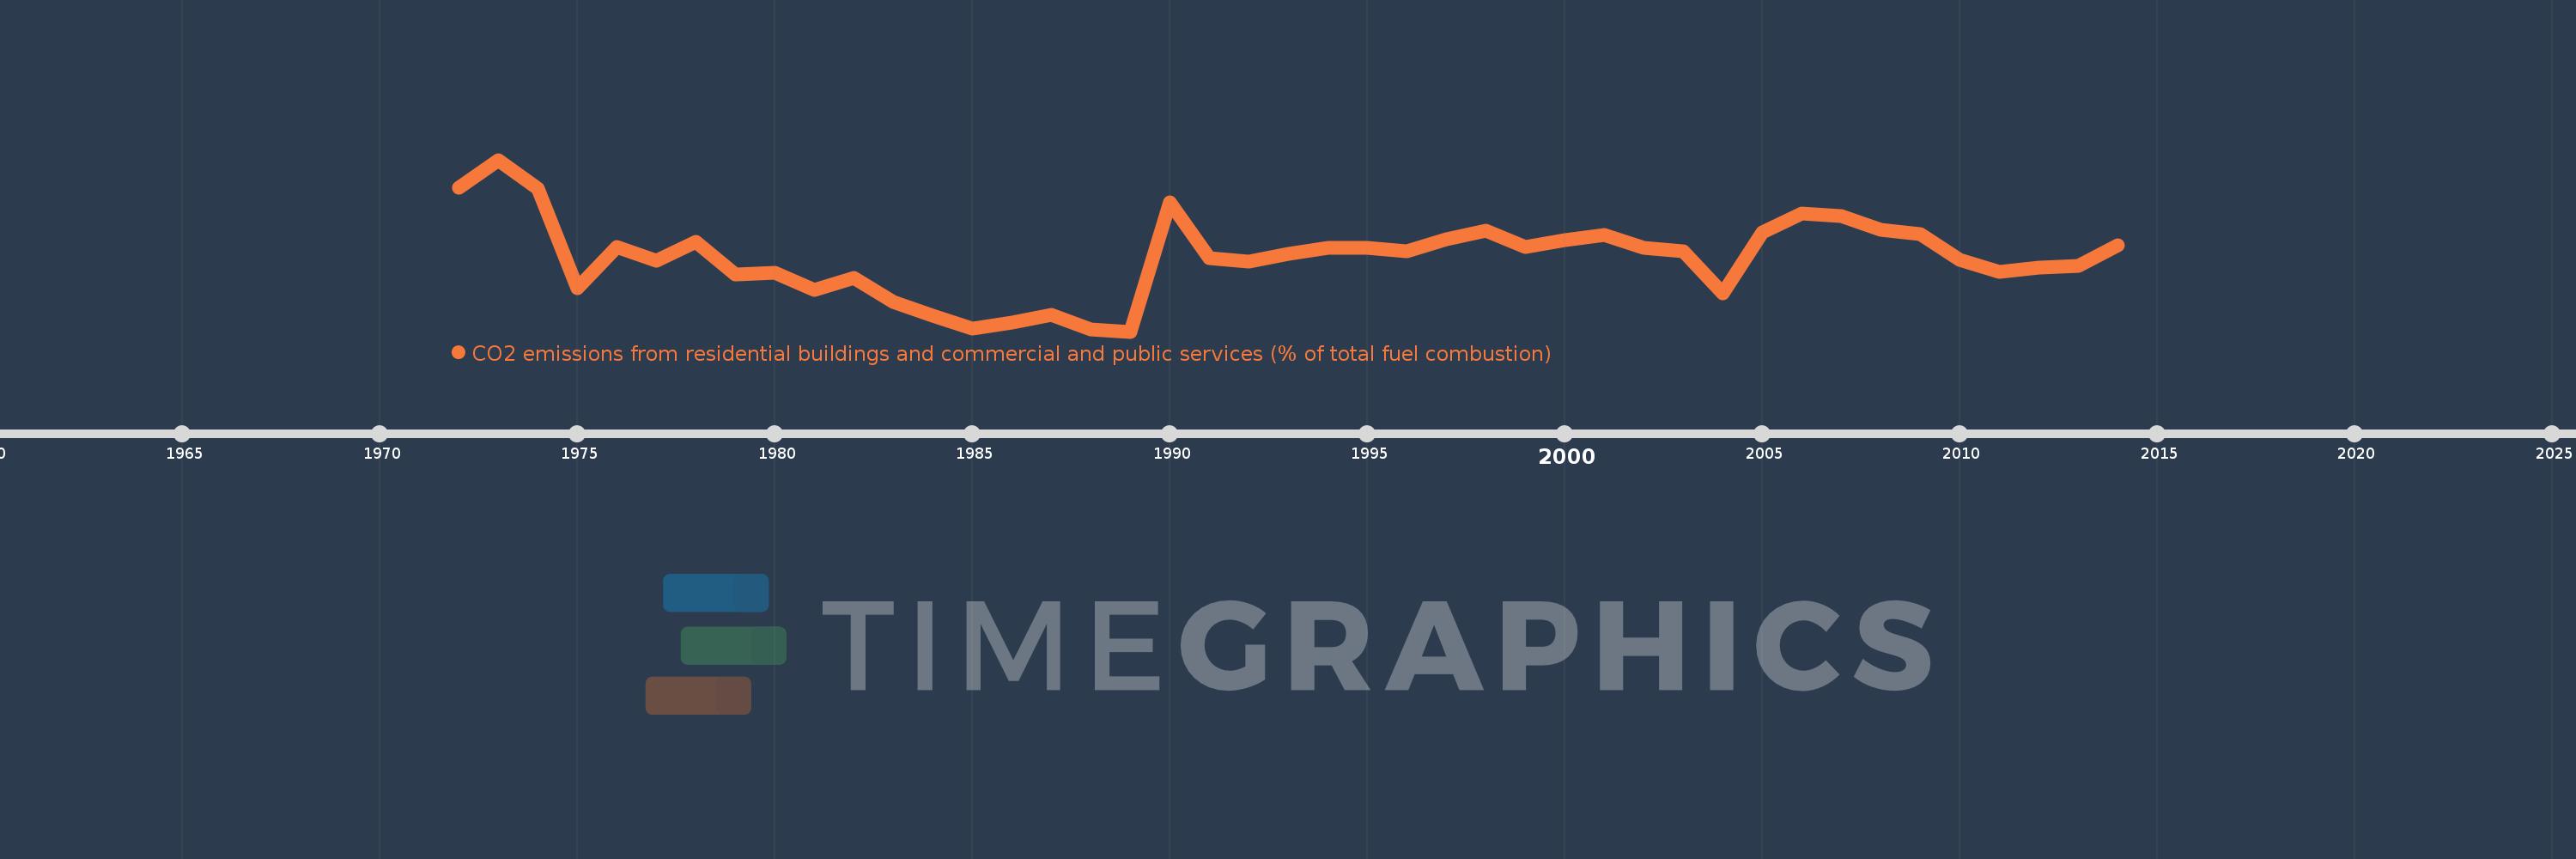
CO2 emissions from residential buildings and commercial and public services (% of total fuel combustion)
2014,2013,2012,2011,2010,2009,2008,2007,2006,2005,2004,2003,2002,2001,2000,1999,1998,1997,1996,1995,1994,1993,1992,1991,1990,1989,1988,1987,1986,1985,1984,1983,1982,1981,1980,1979,1978,1977,1976,1975,1974,1973,1972
Estas estatísticas em outros países:
AlbaniaAlgeriaAngolaArab WorldArgentinaArmeniaAustraliaAustriaAzerbaijanBahrainBangladeshBelarusBelgiumBeninBoliviaBosnia and HerzegovinaBotswanaBrazilBrunei DarussalamBulgariaCambodiaCameroonCanadaCaribbean small statesCentral Europe and the BalticsChileChinaColombiaCongo, Dem. Rep.Congo, Rep.Costa RicaCote d'IvoireCroatiaCubaCuracaoCyprusCzech RepublicDenmarkDominican RepublicEarly-demographic dividendEast Asia & PacificEast Asia & Pacific (excluding high income)East Asia & Pacific (IDA & IBRD countries)EcuadorEgypt, Arab Rep.El SalvadorEritreaEstoniaEthiopiaEuro areaEurope & Central AsiaEurope & Central Asia (excluding high income)Europe & Central Asia (IDA & IBRD countries)European UnionFinlandFragile and conflict affected situationsFranceGabonGeorgiaGermanyGhanaGibraltarGreeceGuatemalaHaitiHeavily indebted poor countries (HIPC)High incomeHondurasHong Kong SAR, ChinaHungaryIBRD onlyIcelandIDA & IBRD totalIDA blendIDA onlyIDA totalIndiaIndonesiaIran, Islamic Rep.IraqIrelandIsraelItalyJamaicaJapanJordanKazakhstanKenyaKorea, Dem. People’s Rep.Korea, Rep.KosovoKuwaitKyrgyz RepublicLate-demographic dividendLatin America & Caribbean Latin America & Caribbean (excluding high income)Latin America & the Caribbean (IDA & IBRD countries)LatviaLeast developed countries: UN classificationLebanonLibyaLithuaniaLow & middle incomeLow incomeLower middle incomeLuxembourgMacedonia, FYRMalaysiaMaltaMauritiusMexicoMiddle East & North AfricaMiddle East & North Africa (excluding high income)Middle East & North Africa (IDA & IBRD countries)Middle incomeMoldovaMongoliaMontenegroMoroccoMozambiqueMyanmarNamibiaNepalNetherlandsNew ZealandNicaraguaNigerNigeriaNorth AmericaNorwayOECD membersOmanOther small statesPakistanPanamaParaguayPeruPhilippinesPolandPortugalPost-demographic dividendPre-demographic dividendQatarRomaniaRussian FederationSaudi ArabiaSenegalSerbiaSingaporeSlovak RepublicSloveniaSmall statesSouth AfricaSouth AsiaSouth Asia (IDA & IBRD)South SudanSpainSri LankaSub-Saharan Africa Sub-Saharan Africa (excluding high income)Sub-Saharan Africa (IDA & IBRD countries)SudanSwedenSwitzerlandSyrian Arab RepublicTajikistanTanzaniaThailandTogoTrinidad and TobagoTunisiaTurkeyTurkmenistanUkraineUnited Arab EmiratesUnited KingdomUnited StatesUpper middle incomeUruguayUzbekistanVenezuela, RBVietnamWorldYemen, Rep.ZambiaZimbabwe Linha do tempo:
Nesta escala de tempo está apresentado um gráfico de 1972 ano até 2014 ano Syrian Arab Republic. Dados de 1971 ano ausente. O número de observações reais por data: 43.
Fonte (nome):
Indicadores de desenvolvimento mundial
Fonte (organização):
IEA Statistics © OECD/IEA 2014 (http://www.iea.org/stats/index.asp), subject to https://www.iea.org/t&c/termsandconditions/
Categorias:
Environment
Foi atualizado:
23 abr 2017 ano
Indicadores de alterações dos valores ao longo dos anos
Mínimo:
5.813
1 jan 1989 ano
Máximo:
17.315
1 jan 1973 ano
Na data de observação
Valor
Mudança absoluta
A alteração em relação ao valor anterior
1 jan 1972 ano
15.47
+15.47
0.0%
1 jan 1973 ano
17.315
+1.846
11.93%
1 jan 1974 ano
15.416
-1.899
-10.97%
1 jan 1975 ano
8.739
-6.677
-43.31%
1 jan 1976 ano
11.501
+2.762
31.6%
1 jan 1977 ano
10.549
-0.952
-8.28%
1 jan 1978 ano
11.829
+1.28
12.13%
1 jan 1979 ano
9.655
-2.174
-18.38%
1 jan 1980 ano
9.752
+0.097
1.01%
1 jan 1981 ano
8.604
-1.149
-11.78%
1 jan 1982 ano
9.38
+0.776
9.01%
1 jan 1983 ano
7.776
-1.604
-17.1%
1 jan 1984 ano
6.854
-0.922
-11.85%
1 jan 1985 ano
6.034
-0.82
-11.96%
1 jan 1986 ano
6.4
+0.366
6.06%
1 jan 1987 ano
6.962
+0.562
8.78%
1 jan 1988 ano
5.969
-0.993
-14.27%
1 jan 1989 ano
5.813
-0.156
-2.62%
1 jan 1990 ano
14.442
+8.629
148.46%
1 jan 1991 ano
10.727
-3.714
-25.72%
1 jan 1992 ano
10.477
-0.251
-2.34%
1 jan 1993 ano
11.033
+0.556
5.3%
1 jan 1994 ano
11.394
+0.362
3.28%
1 jan 1995 ano
11.432
+0.038
0.34%
1 jan 1996 ano
11.183
-0.25
-2.19%
1 jan 1997 ano
11.978
+0.795
7.11%
1 jan 1998 ano
12.576
+0.598
4.99%
1 jan 1999 ano
11.487
-1.089
-8.66%
1 jan 2000 ano
11.926
+0.438
3.82%
1 jan 2001 ano
12.294
+0.368
3.09%
1 jan 2002 ano
11.417
-0.877
-7.13%
1 jan 2003 ano
11.206
-0.211
-1.85%
1 jan 2004 ano
8.396
-2.81
-25.08%
1 jan 2005 ano
12.429
+4.034
48.04%
1 jan 2006 ano
13.732
+1.303
10.48%
1 jan 2007 ano
13.552
-0.18
-1.31%
1 jan 2008 ano
12.603
-0.949
-7.01%
1 jan 2009 ano
12.357
-0.245
-1.95%
1 jan 2010 ano
10.625
-1.733
-14.02%
1 jan 2011 ano
9.83
-0.795
-7.48%
1 jan 2012 ano
10.113
+0.283
2.88%
1 jan 2013 ano
10.207
+0.093
0.92%
1 jan 2014 ano
11.592
+1.386
13.58%
Classificação de países por estatísticas atuais por anos


Comentários: