29
/pt/
pt
AIzaSyAYiBZKx7MnpbEhh9jyipgxe19OcubqV5w
April 1, 2024
224642
Poland
POL
true
2
1
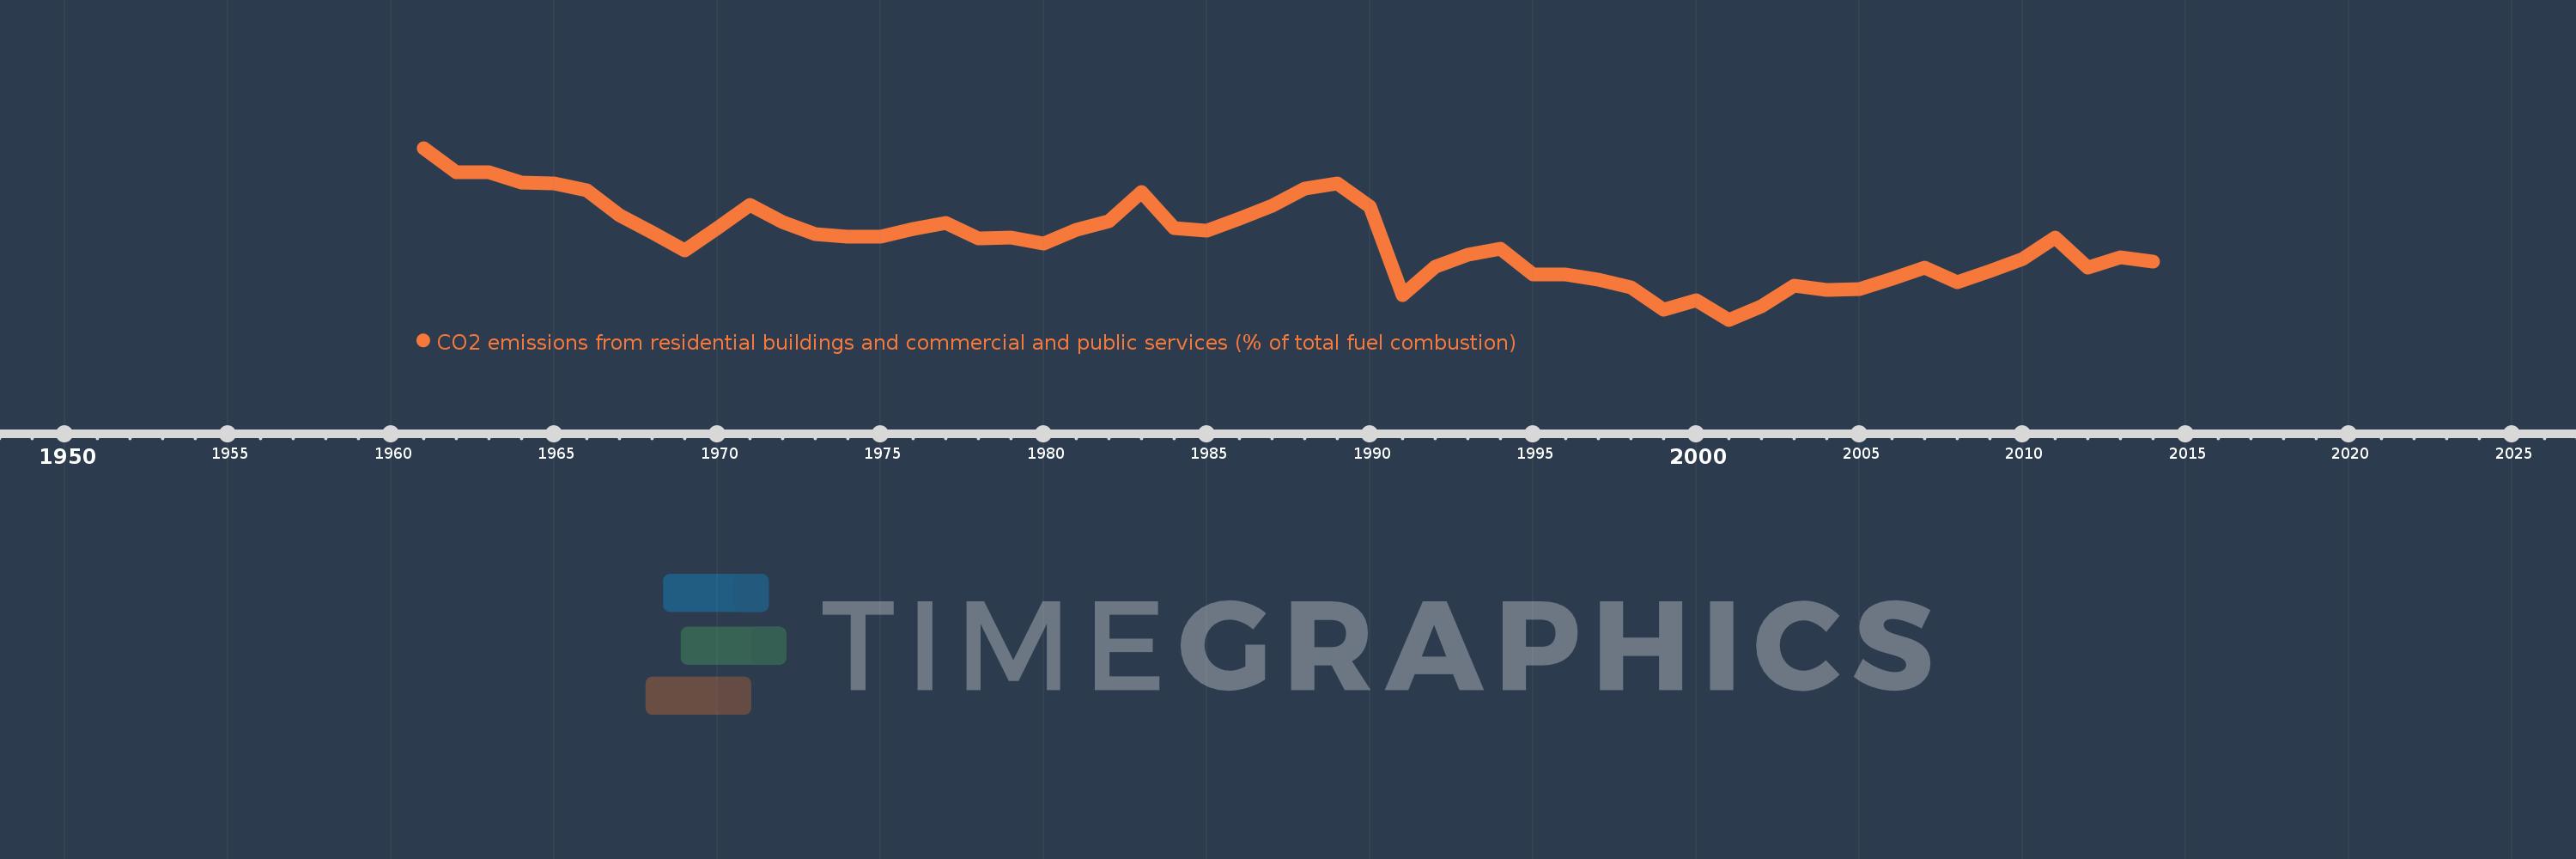
CO2 emissions from residential buildings and commercial and public services (% of total fuel combustion)
2014,2013,2012,2011,2010,2009,2008,2007,2006,2005,2004,2003,2002,2001,2000,1999,1998,1997,1996,1995,1994,1993,1992,1991,1990,1989,1988,1987,1986,1985,1984,1983,1982,1981,1980,1979,1978,1977,1976,1975,1974,1973,1972,1971,1970,1969,1968,1967,1966,1965,1964,1963,1962,1961
Estas estatísticas em outros países:
AlbaniaAlgeriaAngolaArab WorldArgentinaArmeniaAustraliaAustriaAzerbaijanBahrainBangladeshBelarusBelgiumBeninBoliviaBosnia and HerzegovinaBotswanaBrazilBrunei DarussalamBulgariaCambodiaCameroonCanadaCaribbean small statesCentral Europe and the BalticsChileChinaColombiaCongo, Dem. Rep.Congo, Rep.Costa RicaCote d'IvoireCroatiaCubaCuracaoCyprusCzech RepublicDenmarkDominican RepublicEarly-demographic dividendEast Asia & PacificEast Asia & Pacific (excluding high income)East Asia & Pacific (IDA & IBRD countries)EcuadorEgypt, Arab Rep.El SalvadorEritreaEstoniaEthiopiaEuro areaEurope & Central AsiaEurope & Central Asia (excluding high income)Europe & Central Asia (IDA & IBRD countries)European UnionFinlandFragile and conflict affected situationsFranceGabonGeorgiaGermanyGhanaGibraltarGreeceGuatemalaHaitiHeavily indebted poor countries (HIPC)High incomeHondurasHong Kong SAR, ChinaHungaryIBRD onlyIcelandIDA & IBRD totalIDA blendIDA onlyIDA totalIndiaIndonesiaIran, Islamic Rep.IraqIrelandIsraelItalyJamaicaJapanJordanKazakhstanKenyaKorea, Dem. People’s Rep.Korea, Rep.KosovoKuwaitKyrgyz RepublicLate-demographic dividendLatin America & Caribbean Latin America & Caribbean (excluding high income)Latin America & the Caribbean (IDA & IBRD countries)LatviaLeast developed countries: UN classificationLebanonLibyaLithuaniaLow & middle incomeLow incomeLower middle incomeLuxembourgMacedonia, FYRMalaysiaMaltaMauritiusMexicoMiddle East & North AfricaMiddle East & North Africa (excluding high income)Middle East & North Africa (IDA & IBRD countries)Middle incomeMoldovaMongoliaMontenegroMoroccoMozambiqueMyanmarNamibiaNepalNetherlandsNew ZealandNicaraguaNigerNigeriaNorth AmericaNorwayOECD membersOmanOther small statesPakistanPanamaParaguayPeruPhilippinesPolandPortugalPost-demographic dividendPre-demographic dividendQatarRomaniaRussian FederationSaudi ArabiaSenegalSerbiaSingaporeSlovak RepublicSloveniaSmall statesSouth AfricaSouth AsiaSouth Asia (IDA & IBRD)South SudanSpainSri LankaSub-Saharan Africa Sub-Saharan Africa (excluding high income)Sub-Saharan Africa (IDA & IBRD countries)SudanSwedenSwitzerlandSyrian Arab RepublicTajikistanTanzaniaThailandTogoTrinidad and TobagoTunisiaTurkeyTurkmenistanUkraineUnited Arab EmiratesUnited KingdomUnited StatesUpper middle incomeUruguayUzbekistanVenezuela, RBVietnamWorldYemen, Rep.ZambiaZimbabwe Linha do tempo:
Nesta escala de tempo está apresentado um gráfico de 1961 ano até 2014 ano Poland. Dados de 1960 ano ausente. O número de observações reais por data: 54.
Fonte (nome):
Indicadores de desenvolvimento mundial
Fonte (organização):
IEA Statistics © OECD/IEA 2014 (http://www.iea.org/stats/index.asp), subject to https://www.iea.org/t&c/termsandconditions/
Categorias:
Environment
Foi atualizado:
23 abr 2017 ano
Indicadores de alterações dos valores ao longo dos anos
Mínimo:
11.158
1 jan 2001 ano
Máximo:
24.521
1 jan 1961 ano
Na data de observação
Valor
Mudança absoluta
A alteração em relação ao valor anterior
1 jan 1961 ano
24.521
+24.521
0.0%
1 jan 1962 ano
22.611
-1.91
-7.79%
1 jan 1963 ano
22.62
+0.009
0.04%
1 jan 1964 ano
21.857
-0.762
-3.37%
1 jan 1965 ano
21.75
-0.108
-0.49%
1 jan 1966 ano
21.244
-0.505
-2.32%
1 jan 1967 ano
19.285
-1.959
-9.22%
1 jan 1968 ano
17.937
-1.348
-6.99%
1 jan 1969 ano
16.524
-1.413
-7.88%
1 jan 1970 ano
18.313
+1.789
10.82%
1 jan 1971 ano
20.063
+1.75
9.56%
1 jan 1972 ano
18.784
-1.279
-6.37%
1 jan 1973 ano
17.834
-0.95
-5.06%
1 jan 1974 ano
17.615
-0.219
-1.23%
1 jan 1975 ano
17.652
+0.037
0.21%
1 jan 1976 ano
18.232
+0.58
3.28%
1 jan 1977 ano
18.721
+0.489
2.68%
1 jan 1978 ano
17.501
-1.219
-6.51%
1 jan 1979 ano
17.555
+0.054
0.31%
1 jan 1980 ano
17.113
-0.442
-2.52%
1 jan 1981 ano
18.125
+1.012
5.91%
1 jan 1982 ano
18.818
+0.693
3.82%
1 jan 1983 ano
21.072
+2.254
11.98%
1 jan 1984 ano
18.295
-2.777
-13.18%
1 jan 1985 ano
18.055
-0.24
-1.31%
1 jan 1986 ano
19.004
+0.949
5.25%
1 jan 1987 ano
20.017
+1.013
5.33%
1 jan 1988 ano
21.344
+1.327
6.63%
1 jan 1989 ano
21.746
+0.402
1.89%
1 jan 1990 ano
19.939
-1.807
-8.31%
1 jan 1991 ano
13.047
-6.892
-34.57%
1 jan 1992 ano
15.305
+2.258
17.31%
1 jan 1993 ano
16.197
+0.892
5.83%
1 jan 1994 ano
16.69
+0.493
3.04%
1 jan 1995 ano
14.676
-2.013
-12.06%
1 jan 1996 ano
14.697
+0.02
0.14%
1 jan 1997 ano
14.256
-0.44
-3.0%
1 jan 1998 ano
13.661
-0.595
-4.17%
1 jan 1999 ano
11.927
-1.734
-12.7%
1 jan 2000 ano
12.695
+0.768
6.44%
1 jan 2001 ano
11.158
-1.537
-12.11%
1 jan 2002 ano
12.23
+1.072
9.61%
1 jan 2003 ano
13.825
+1.595
13.04%
1 jan 2004 ano
13.479
-0.346
-2.51%
1 jan 2005 ano
13.51
+0.031
0.23%
1 jan 2006 ano
14.313
+0.804
5.95%
1 jan 2007 ano
15.193
+0.88
6.15%
1 jan 2008 ano
14.063
-1.129
-7.43%
1 jan 2009 ano
14.974
+0.911
6.48%
1 jan 2010 ano
15.903
+0.928
6.2%
1 jan 2011 ano
17.546
+1.643
10.33%
1 jan 2012 ano
15.199
-2.347
-13.38%
1 jan 2013 ano
16.033
+0.835
5.49%
1 jan 2014 ano
15.661
-0.372
-2.32%
Classificação de países por estatísticas atuais por anos


Comentários: