29
/pt/
pt
AIzaSyAYiBZKx7MnpbEhh9jyipgxe19OcubqV5w
April 1, 2024
70078
Argentina
ARG
true
2
1
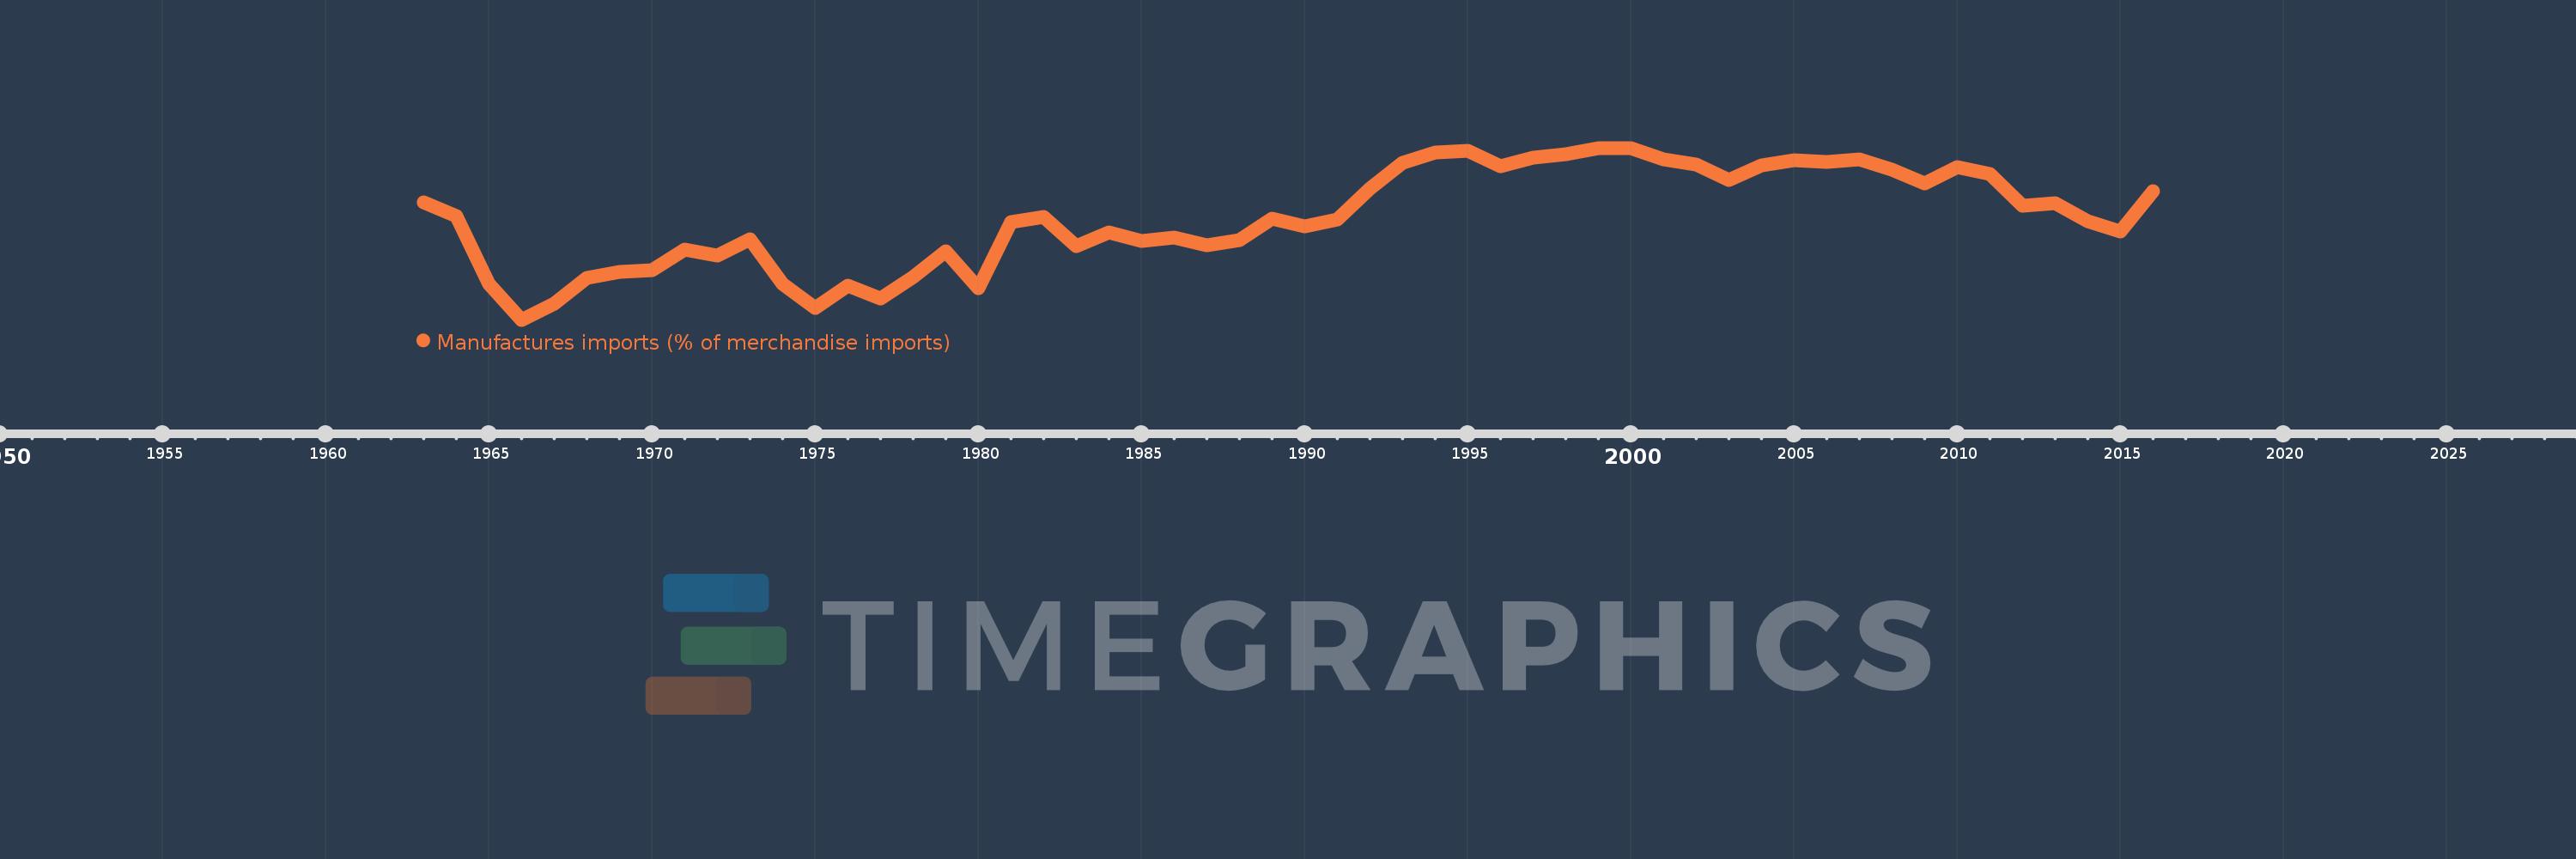
Manufactures imports (% of merchandise imports)
2016,2015,2014,2013,2012,2011,2010,2009,2008,2007,2006,2005,2004,2003,2002,2001,2000,1999,1998,1997,1996,1995,1994,1993,1992,1991,1990,1989,1988,1987,1986,1985,1984,1983,1982,1981,1980,1979,1978,1977,1976,1975,1974,1973,1972,1971,1970,1969,1968,1967,1966,1965,1964,1963
Estas estatísticas em outros países:
AfghanistanAlbaniaAlgeriaAndorraAngolaAntigua and BarbudaArab WorldArgentinaArmeniaArubaAustraliaAustriaAzerbaijanBahamas, TheBahrainBangladeshBarbadosBelarusBelgiumBelizeBeninBermudaBhutanBoliviaBosnia and HerzegovinaBotswanaBrazilBrunei DarussalamBulgariaBurkina FasoBurundiCabo VerdeCambodiaCameroonCanadaCaribbean small statesCayman IslandsCentral African RepublicCentral Europe and the BalticsChadChileChinaColombiaComorosCongo, Dem. Rep.Congo, Rep.Costa RicaCote d'IvoireCroatiaCubaCyprusCzech RepublicDenmarkDjiboutiDominicaDominican RepublicEarly-demographic dividendEast Asia & PacificEast Asia & Pacific (excluding high income)East Asia & Pacific (IDA & IBRD countries)EcuadorEgypt, Arab Rep.El SalvadorEquatorial GuineaEritreaEstoniaEthiopiaEuro areaEurope & Central AsiaEurope & Central Asia (excluding high income)Europe & Central Asia (IDA & IBRD countries)European UnionFaroe IslandsFijiFinlandFragile and conflict affected situationsFranceFrench PolynesiaGabonGambia, TheGeorgiaGermanyGhanaGreeceGreenlandGrenadaGuatemalaGuineaGuinea-BissauGuyanaHaitiHeavily indebted poor countries (HIPC)High incomeHondurasHong Kong SAR, ChinaHungaryIBRD onlyIcelandIDA & IBRD totalIDA blendIDA onlyIDA totalIndiaIndonesiaIran, Islamic Rep.IraqIrelandIsraelItalyJamaicaJapanJordanKazakhstanKenyaKiribatiKorea, Rep.KuwaitKyrgyz RepublicLao PDRLate-demographic dividendLatin America & Caribbean Latin America & Caribbean (excluding high income)Latin America & the Caribbean (IDA & IBRD countries)LatviaLeast developed countries: UN classificationLebanonLesothoLiberiaLibyaLithuaniaLow & middle incomeLow incomeLower middle incomeLuxembourgMacao SAR, ChinaMacedonia, FYRMadagascarMalawiMalaysiaMaldivesMaliMaltaMauritaniaMauritiusMexicoMiddle East & North AfricaMiddle East & North Africa (excluding high income)Middle East & North Africa (IDA & IBRD countries)Middle incomeMoldovaMongoliaMoroccoMozambiqueMyanmarNamibiaNepalNetherlandsNew CaledoniaNew ZealandNicaraguaNigerNigeriaNorth AmericaNorwayOECD membersOmanOther small statesPacific island small statesPakistanPalauPanamaPapua New GuineaParaguayPeruPhilippinesPolandPortugalPost-demographic dividendPre-demographic dividendQatarRomaniaRussian FederationRwandaSamoaSao Tome and PrincipeSaudi ArabiaSenegalSerbiaSeychellesSierra LeoneSingaporeSlovak RepublicSloveniaSmall statesSolomon IslandsSomaliaSouth AfricaSouth AsiaSouth Asia (IDA & IBRD)SpainSri LankaSt. Kitts and NevisSt. LuciaSt. Vincent and the GrenadinesSub-Saharan Africa Sub-Saharan Africa (excluding high income)Sub-Saharan Africa (IDA & IBRD countries)SudanSurinameSwazilandSwedenSwitzerlandSyrian Arab RepublicTajikistanTanzaniaThailandTimor-LesteTogoTongaTrinidad and TobagoTunisiaTurkeyTurkmenistanTurks and Caicos IslandsTuvaluUgandaUkraineUnited Arab EmiratesUnited KingdomUnited StatesUpper middle incomeUruguayVanuatuVenezuela, RBVietnamVirgin Islands (U.S.)WorldYemen, Rep.ZambiaZimbabwe Linha do tempo:
Nesta escala de tempo está apresentado um gráfico de 1963 ano até 2016 ano Argentina. Dados de 1962 ano ausente. O número de observações reais por data: 54.
Fonte (nome):
Indicadores de desenvolvimento mundial
Fonte (organização):
World Bank staff estimates from the Comtrade database maintained by the United Nations Statistics Division.
Categorias:
Private Sector, Trade
Foi atualizado:
23 abr 2017 ano
Indicadores de alterações dos valores ao longo dos anos
Mínimo:
62.195
1 jan 1966 ano
Máximo:
88.806
1 jan 1999 ano
Na data de observação
Valor
Mudança absoluta
A alteração em relação ao valor anterior
1 jan 1963 ano
80.366
+80.366
0.0%
1 jan 1964 ano
78.27
-2.096
-2.61%
1 jan 1965 ano
67.745
-10.525
-13.45%
1 jan 1966 ano
62.195
-5.551
-8.19%
1 jan 1967 ano
64.651
+2.456
3.95%
1 jan 1968 ano
68.704
+4.053
6.27%
1 jan 1969 ano
69.556
+0.852
1.24%
1 jan 1970 ano
69.89
+0.334
0.48%
1 jan 1971 ano
73.059
+3.169
4.53%
1 jan 1972 ano
72.145
-0.914
-1.25%
1 jan 1973 ano
74.649
+2.504
3.47%
1 jan 1974 ano
67.72
-6.929
-9.28%
1 jan 1975 ano
64.003
-3.717
-5.49%
1 jan 1976 ano
67.419
+3.416
5.34%
1 jan 1977 ano
65.416
-2.003
-2.97%
1 jan 1978 ano
68.798
+3.382
5.17%
1 jan 1979 ano
72.793
+3.994
5.81%
1 jan 1980 ano
67.049
-5.743
-7.89%
1 jan 1981 ano
77.332
+10.283
15.34%
1 jan 1982 ano
78.098
+0.766
0.99%
1 jan 1983 ano
73.658
-4.44
-5.68%
1 jan 1984 ano
75.786
+2.128
2.89%
1 jan 1985 ano
74.438
-1.348
-1.78%
1 jan 1986 ano
74.97
+0.532
0.71%
1 jan 1987 ano
73.792
-1.178
-1.57%
1 jan 1988 ano
74.526
+0.735
1.0%
1 jan 1989 ano
77.81
+3.284
4.41%
1 jan 1990 ano
76.674
-1.136
-1.46%
1 jan 1991 ano
77.726
+1.052
1.37%
1 jan 1992 ano
82.45
+4.724
6.08%
1 jan 1993 ano
86.501
+4.05
4.91%
1 jan 1994 ano
88.115
+1.615
1.87%
1 jan 1995 ano
88.362
+0.247
0.28%
1 jan 1996 ano
85.968
-2.394
-2.71%
1 jan 1997 ano
87.274
+1.306
1.52%
1 jan 1998 ano
87.897
+0.623
0.71%
1 jan 1999 ano
88.806
+0.909
1.03%
1 jan 2000 ano
88.784
-0.022
-0.02%
1 jan 2001 ano
86.984
-1.801
-2.03%
1 jan 2002 ano
86.245
-0.738
-0.85%
1 jan 2003 ano
83.892
-2.353
-2.73%
1 jan 2004 ano
86.073
+2.181
2.6%
1 jan 2005 ano
86.881
+0.808
0.94%
1 jan 2006 ano
86.675
-0.206
-0.24%
1 jan 2007 ano
86.992
+0.317
0.37%
1 jan 2008 ano
85.483
-1.509
-1.73%
1 jan 2009 ano
83.355
-2.128
-2.49%
1 jan 2010 ano
85.813
+2.458
2.95%
1 jan 2011 ano
84.728
-1.084
-1.26%
1 jan 2012 ano
79.851
-4.877
-5.76%
1 jan 2013 ano
80.232
+0.38
0.48%
1 jan 2014 ano
77.398
-2.833
-3.53%
1 jan 2015 ano
75.867
-1.531
-1.98%
1 jan 2016 ano
82.05
+6.183
8.15%
Classificação de países por estatísticas atuais por anos


Comentários: