29
/pt/
pt
AIzaSyAYiBZKx7MnpbEhh9jyipgxe19OcubqV5w
April 1, 2024
152767
Hungary
HUN
true
2
1
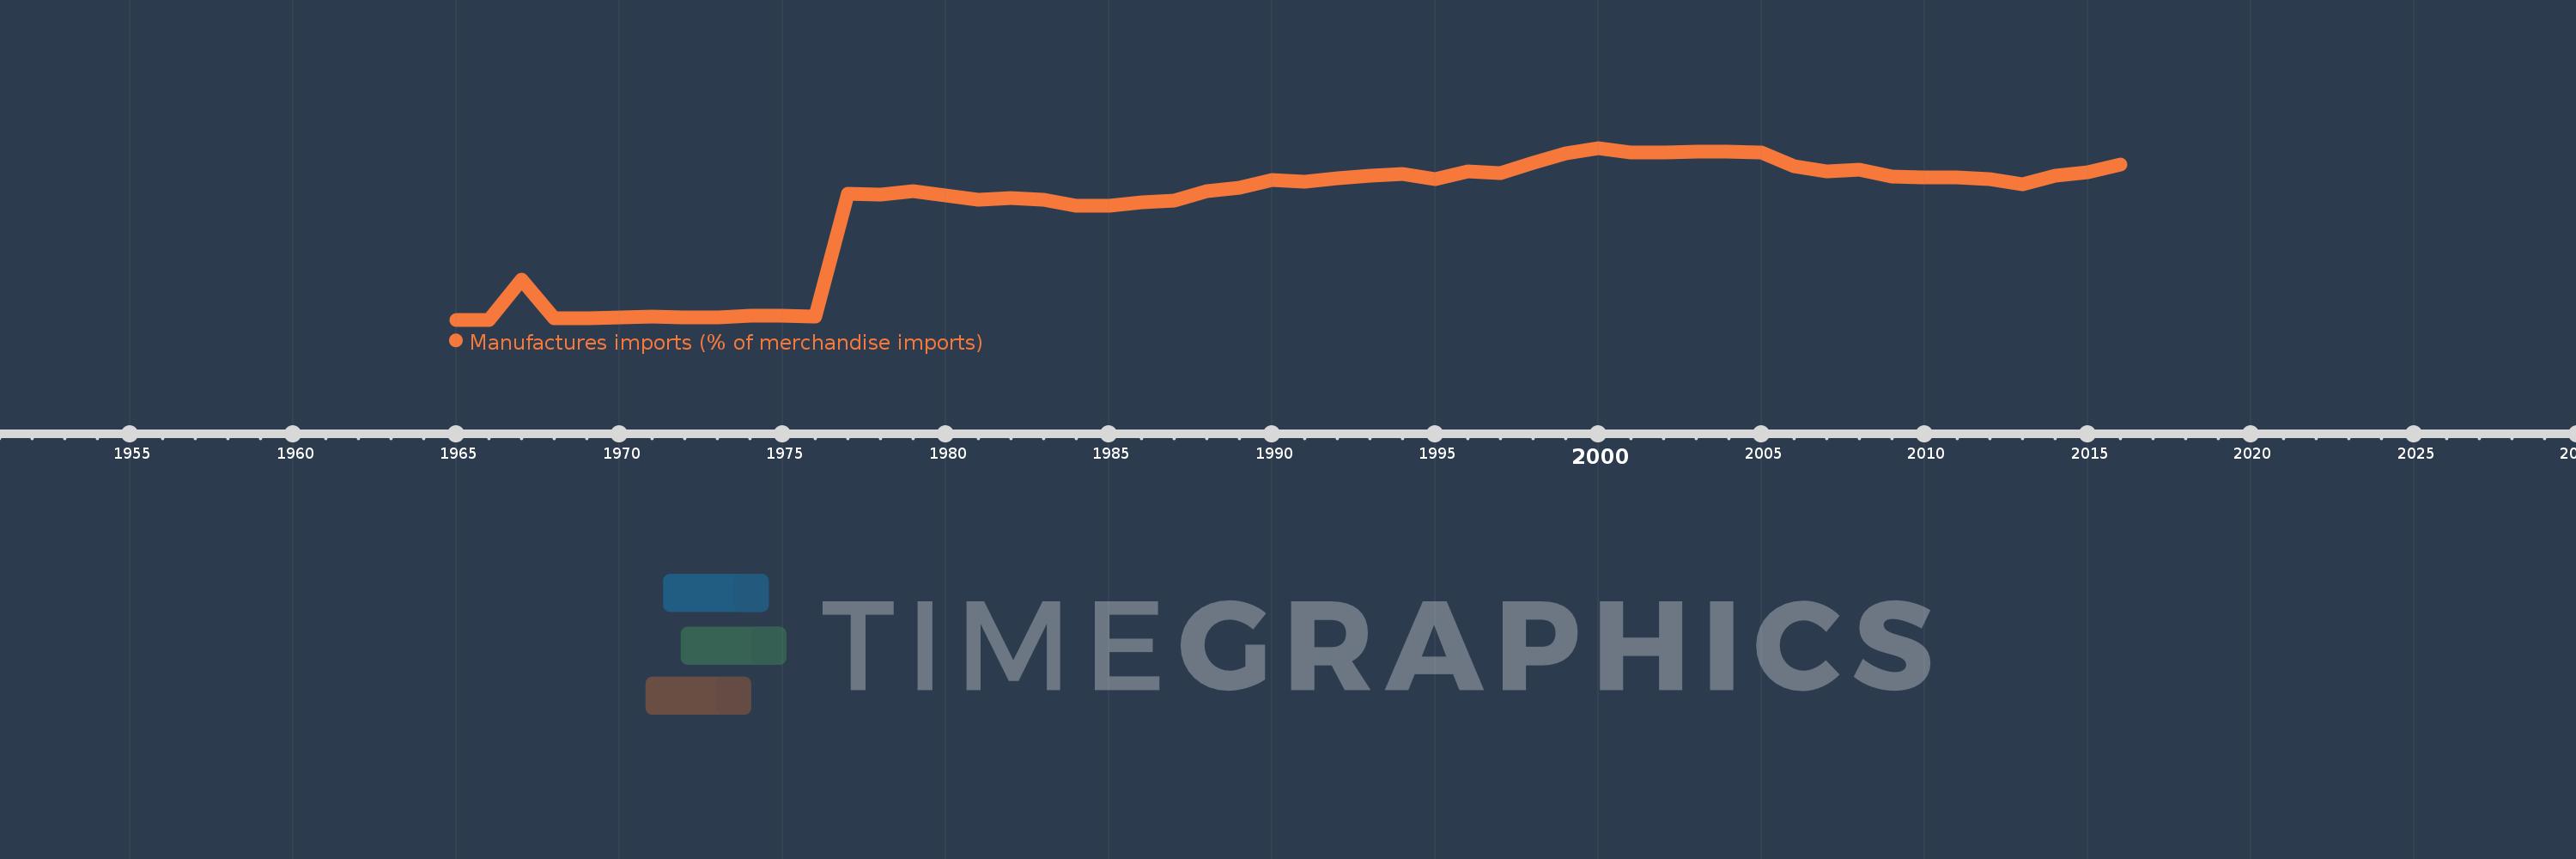
Manufactures imports (% of merchandise imports)
2016,2015,2014,2013,2012,2011,2010,2009,2008,2007,2006,2005,2004,2003,2002,2001,2000,1999,1998,1997,1996,1995,1994,1993,1992,1991,1990,1989,1988,1987,1986,1985,1984,1983,1982,1981,1980,1979,1978,1977,1976,1975,1974,1973,1972,1971,1970,1969,1968,1967,1966,1965
Estas estatísticas em outros países:
AfghanistanAlbaniaAlgeriaAndorraAngolaAntigua and BarbudaArab WorldArgentinaArmeniaArubaAustraliaAustriaAzerbaijanBahamas, TheBahrainBangladeshBarbadosBelarusBelgiumBelizeBeninBermudaBhutanBoliviaBosnia and HerzegovinaBotswanaBrazilBrunei DarussalamBulgariaBurkina FasoBurundiCabo VerdeCambodiaCameroonCanadaCaribbean small statesCayman IslandsCentral African RepublicCentral Europe and the BalticsChadChileChinaColombiaComorosCongo, Dem. Rep.Congo, Rep.Costa RicaCote d'IvoireCroatiaCubaCyprusCzech RepublicDenmarkDjiboutiDominicaDominican RepublicEarly-demographic dividendEast Asia & PacificEast Asia & Pacific (excluding high income)East Asia & Pacific (IDA & IBRD countries)EcuadorEgypt, Arab Rep.El SalvadorEquatorial GuineaEritreaEstoniaEthiopiaEuro areaEurope & Central AsiaEurope & Central Asia (excluding high income)Europe & Central Asia (IDA & IBRD countries)European UnionFaroe IslandsFijiFinlandFragile and conflict affected situationsFranceFrench PolynesiaGabonGambia, TheGeorgiaGermanyGhanaGreeceGreenlandGrenadaGuatemalaGuineaGuinea-BissauGuyanaHaitiHeavily indebted poor countries (HIPC)High incomeHondurasHong Kong SAR, ChinaHungaryIBRD onlyIcelandIDA & IBRD totalIDA blendIDA onlyIDA totalIndiaIndonesiaIran, Islamic Rep.IraqIrelandIsraelItalyJamaicaJapanJordanKazakhstanKenyaKiribatiKorea, Rep.KuwaitKyrgyz RepublicLao PDRLate-demographic dividendLatin America & Caribbean Latin America & Caribbean (excluding high income)Latin America & the Caribbean (IDA & IBRD countries)LatviaLeast developed countries: UN classificationLebanonLesothoLiberiaLibyaLithuaniaLow & middle incomeLow incomeLower middle incomeLuxembourgMacao SAR, ChinaMacedonia, FYRMadagascarMalawiMalaysiaMaldivesMaliMaltaMauritaniaMauritiusMexicoMiddle East & North AfricaMiddle East & North Africa (excluding high income)Middle East & North Africa (IDA & IBRD countries)Middle incomeMoldovaMongoliaMoroccoMozambiqueMyanmarNamibiaNepalNetherlandsNew CaledoniaNew ZealandNicaraguaNigerNigeriaNorth AmericaNorwayOECD membersOmanOther small statesPacific island small statesPakistanPalauPanamaPapua New GuineaParaguayPeruPhilippinesPolandPortugalPost-demographic dividendPre-demographic dividendQatarRomaniaRussian FederationRwandaSamoaSao Tome and PrincipeSaudi ArabiaSenegalSerbiaSeychellesSierra LeoneSingaporeSlovak RepublicSloveniaSmall statesSolomon IslandsSomaliaSouth AfricaSouth AsiaSouth Asia (IDA & IBRD)SpainSri LankaSt. Kitts and NevisSt. LuciaSt. Vincent and the GrenadinesSub-Saharan Africa Sub-Saharan Africa (excluding high income)Sub-Saharan Africa (IDA & IBRD countries)SudanSurinameSwazilandSwedenSwitzerlandSyrian Arab RepublicTajikistanTanzaniaThailandTimor-LesteTogoTongaTrinidad and TobagoTunisiaTurkeyTurkmenistanTurks and Caicos IslandsTuvaluUgandaUkraineUnited Arab EmiratesUnited KingdomUnited StatesUpper middle incomeUruguayVanuatuVenezuela, RBVietnamVirgin Islands (U.S.)WorldYemen, Rep.ZambiaZimbabwe Linha do tempo:
Nesta escala de tempo está apresentado um gráfico de 1965 ano até 2016 ano Hungary. Dados de 1964 ano ausente. O número de observações reais por data: 52.
Fonte (nome):
Indicadores de desenvolvimento mundial
Fonte (organização):
World Bank staff estimates from the Comtrade database maintained by the United Nations Statistics Division.
Categorias:
Private Sector, Trade
Foi atualizado:
23 abr 2017 ano
Indicadores de alterações dos valores ao longo dos anos
Mínimo:
5.936
1 jan 1966 ano
Máximo:
85.935
1 jan 2000 ano
Na data de observação
Valor
Mudança absoluta
A alteração em relação ao valor anterior
1 jan 1965 ano
5.945
+5.945
0.0%
1 jan 1966 ano
5.936
-0.009
-0.15%
1 jan 1967 ano
24.767
+18.831
317.22%
1 jan 1968 ano
6.49
-18.277
-73.8%
1 jan 1969 ano
6.725
+0.235
3.62%
1 jan 1970 ano
7.097
+0.372
5.53%
1 jan 1971 ano
7.268
+0.171
2.41%
1 jan 1972 ano
7.051
-0.217
-2.99%
1 jan 1973 ano
7.153
+0.102
1.45%
1 jan 1974 ano
7.768
+0.615
8.6%
1 jan 1975 ano
7.693
-0.075
-0.97%
1 jan 1976 ano
7.578
-0.115
-1.5%
1 jan 1977 ano
64.482
+56.904
750.9%
1 jan 1978 ano
64.389
-0.093
-0.14%
1 jan 1979 ano
65.812
+1.423
2.21%
1 jan 1980 ano
63.69
-2.122
-3.22%
1 jan 1981 ano
61.962
-1.728
-2.71%
1 jan 1982 ano
62.642
+0.68
1.1%
1 jan 1983 ano
61.889
-0.754
-1.2%
1 jan 1984 ano
59.051
-2.838
-4.59%
1 jan 1985 ano
59.014
-0.037
-0.06%
1 jan 1986 ano
60.621
+1.607
2.72%
1 jan 1987 ano
61.325
+0.704
1.16%
1 jan 1988 ano
65.767
+4.442
7.24%
1 jan 1989 ano
67.477
+1.71
2.6%
1 jan 1990 ano
71.189
+3.713
5.5%
1 jan 1991 ano
70.351
-0.838
-1.18%
1 jan 1992 ano
71.787
+1.435
2.04%
1 jan 1993 ano
72.914
+1.127
1.57%
1 jan 1994 ano
73.782
+0.868
1.19%
1 jan 1995 ano
71.579
-2.202
-2.98%
1 jan 1996 ano
75.056
+3.477
4.86%
1 jan 1997 ano
74.254
-0.802
-1.07%
1 jan 1998 ano
79.075
+4.822
6.49%
1 jan 1999 ano
83.585
+4.51
5.7%
1 jan 2000 ano
85.935
+2.35
2.81%
1 jan 2001 ano
83.834
-2.101
-2.45%
1 jan 2002 ano
83.83
-0.005
-0.01%
1 jan 2003 ano
84.308
+0.478
0.57%
1 jan 2004 ano
84.318
+0.01
0.01%
1 jan 2005 ano
83.997
-0.321
-0.38%
1 jan 2006 ano
77.393
-6.604
-7.86%
1 jan 2007 ano
74.908
-2.485
-3.21%
1 jan 2008 ano
75.769
+0.861
1.15%
1 jan 2009 ano
72.514
-3.255
-4.3%
1 jan 2010 ano
72.035
-0.479
-0.66%
1 jan 2011 ano
72.067
+0.032
0.04%
1 jan 2012 ano
71.248
-0.819
-1.14%
1 jan 2013 ano
69.001
-2.248
-3.15%
1 jan 2014 ano
72.91
+3.909
5.67%
1 jan 2015 ano
74.534
+1.624
2.23%
1 jan 2016 ano
78.106
+3.572
4.79%
Classificação de países por estatísticas atuais por anos


Comentários: