29
/pt/
pt
AIzaSyAYiBZKx7MnpbEhh9jyipgxe19OcubqV5w
April 1, 2024
267083
Trinidad and Tobago
TTO
true
2
1
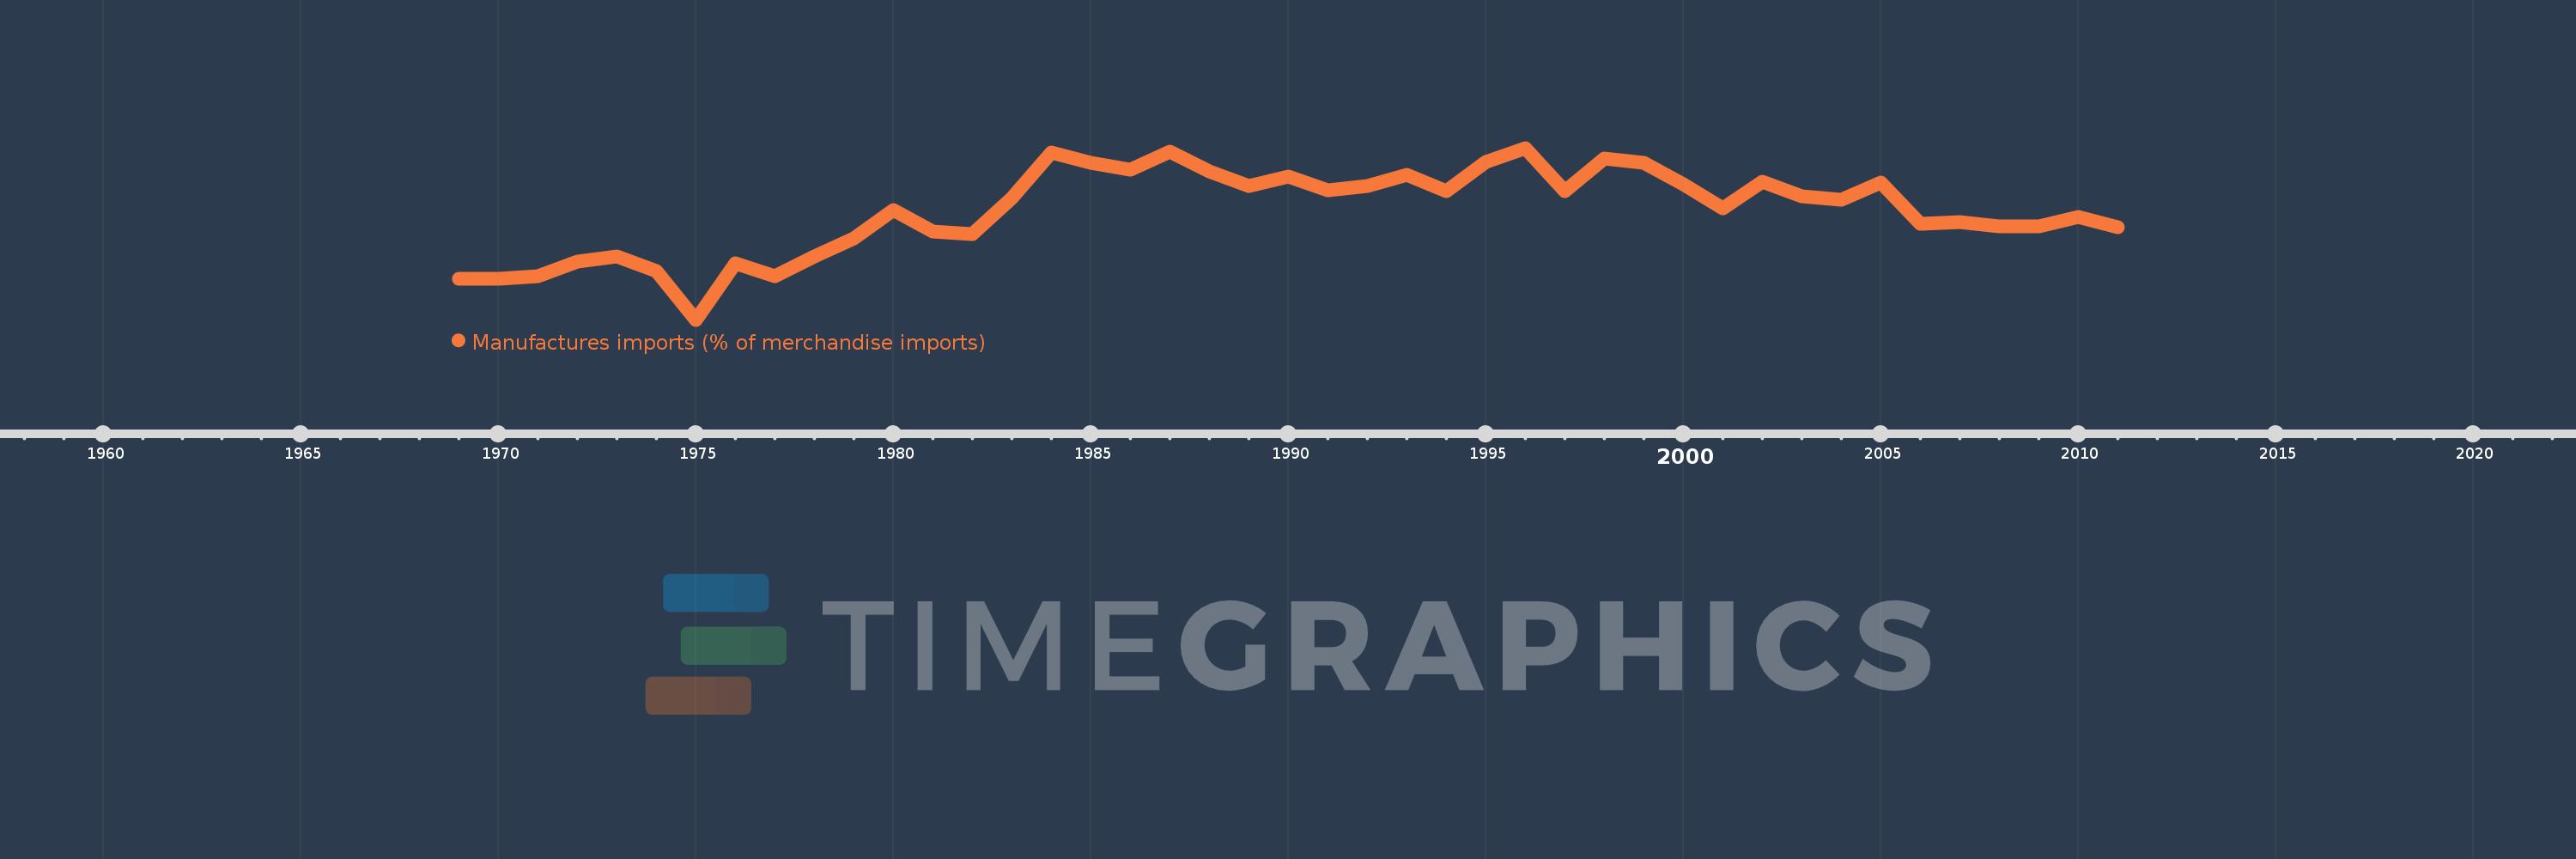
Manufactures imports (% of merchandise imports)
2011,2010,2009,2008,2007,2006,2005,2004,2003,2002,2001,2000,1999,1998,1997,1996,1995,1994,1993,1992,1991,1990,1989,1988,1987,1986,1985,1984,1983,1982,1981,1980,1979,1978,1977,1976,1975,1974,1973,1972,1971,1970,1969
Estas estatísticas em outros países:
AfghanistanAlbaniaAlgeriaAndorraAngolaAntigua and BarbudaArab WorldArgentinaArmeniaArubaAustraliaAustriaAzerbaijanBahamas, TheBahrainBangladeshBarbadosBelarusBelgiumBelizeBeninBermudaBhutanBoliviaBosnia and HerzegovinaBotswanaBrazilBrunei DarussalamBulgariaBurkina FasoBurundiCabo VerdeCambodiaCameroonCanadaCaribbean small statesCayman IslandsCentral African RepublicCentral Europe and the BalticsChadChileChinaColombiaComorosCongo, Dem. Rep.Congo, Rep.Costa RicaCote d'IvoireCroatiaCubaCyprusCzech RepublicDenmarkDjiboutiDominicaDominican RepublicEarly-demographic dividendEast Asia & PacificEast Asia & Pacific (excluding high income)East Asia & Pacific (IDA & IBRD countries)EcuadorEgypt, Arab Rep.El SalvadorEquatorial GuineaEritreaEstoniaEthiopiaEuro areaEurope & Central AsiaEurope & Central Asia (excluding high income)Europe & Central Asia (IDA & IBRD countries)European UnionFaroe IslandsFijiFinlandFragile and conflict affected situationsFranceFrench PolynesiaGabonGambia, TheGeorgiaGermanyGhanaGreeceGreenlandGrenadaGuatemalaGuineaGuinea-BissauGuyanaHaitiHeavily indebted poor countries (HIPC)High incomeHondurasHong Kong SAR, ChinaHungaryIBRD onlyIcelandIDA & IBRD totalIDA blendIDA onlyIDA totalIndiaIndonesiaIran, Islamic Rep.IraqIrelandIsraelItalyJamaicaJapanJordanKazakhstanKenyaKiribatiKorea, Rep.KuwaitKyrgyz RepublicLao PDRLate-demographic dividendLatin America & Caribbean Latin America & Caribbean (excluding high income)Latin America & the Caribbean (IDA & IBRD countries)LatviaLeast developed countries: UN classificationLebanonLesothoLiberiaLibyaLithuaniaLow & middle incomeLow incomeLower middle incomeLuxembourgMacao SAR, ChinaMacedonia, FYRMadagascarMalawiMalaysiaMaldivesMaliMaltaMauritaniaMauritiusMexicoMiddle East & North AfricaMiddle East & North Africa (excluding high income)Middle East & North Africa (IDA & IBRD countries)Middle incomeMoldovaMongoliaMoroccoMozambiqueMyanmarNamibiaNepalNetherlandsNew CaledoniaNew ZealandNicaraguaNigerNigeriaNorth AmericaNorwayOECD membersOmanOther small statesPacific island small statesPakistanPalauPanamaPapua New GuineaParaguayPeruPhilippinesPolandPortugalPost-demographic dividendPre-demographic dividendQatarRomaniaRussian FederationRwandaSamoaSao Tome and PrincipeSaudi ArabiaSenegalSerbiaSeychellesSierra LeoneSingaporeSlovak RepublicSloveniaSmall statesSolomon IslandsSomaliaSouth AfricaSouth AsiaSouth Asia (IDA & IBRD)SpainSri LankaSt. Kitts and NevisSt. LuciaSt. Vincent and the GrenadinesSub-Saharan Africa Sub-Saharan Africa (excluding high income)Sub-Saharan Africa (IDA & IBRD countries)SudanSurinameSwazilandSwedenSwitzerlandSyrian Arab RepublicTajikistanTanzaniaThailandTimor-LesteTogoTongaTrinidad and TobagoTunisiaTurkeyTurkmenistanTurks and Caicos IslandsTuvaluUgandaUkraineUnited Arab EmiratesUnited KingdomUnited StatesUpper middle incomeUruguayVanuatuVenezuela, RBVietnamVirgin Islands (U.S.)WorldYemen, Rep.ZambiaZimbabwe Linha do tempo:
Nesta escala de tempo está apresentado um gráfico de 1969 ano até 2011 ano Trinidad and Tobago. Dados de 1968 ano ausente. O número de observações reais por data: 43.
Fonte (nome):
Indicadores de desenvolvimento mundial
Fonte (organização):
World Bank staff estimates from the Comtrade database maintained by the United Nations Statistics Division.
Categorias:
Private Sector, Trade
Foi atualizado:
23 abr 2017 ano
Indicadores de alterações dos valores ao longo dos anos
Mínimo:
19.442
1 jan 1975 ano
Máximo:
76.037
1 jan 1996 ano
Na data de observação
Valor
Mudança absoluta
A alteração em relação ao valor anterior
1 jan 1969 ano
32.89
+32.89
0.0%
1 jan 1970 ano
32.827
-0.063
-0.19%
1 jan 1971 ano
33.92
+1.092
3.33%
1 jan 1972 ano
38.459
+4.539
13.38%
1 jan 1973 ano
40.263
+1.805
4.69%
1 jan 1974 ano
35.533
-4.73
-11.75%
1 jan 1975 ano
19.442
-16.091
-45.28%
1 jan 1976 ano
38.082
+18.639
95.87%
1 jan 1977 ano
33.831
-4.251
-11.16%
1 jan 1978 ano
40.287
+6.456
19.08%
1 jan 1979 ano
46.237
+5.95
14.77%
1 jan 1980 ano
55.707
+9.47
20.48%
1 jan 1981 ano
48.601
-7.106
-12.76%
1 jan 1982 ano
47.572
-1.029
-2.12%
1 jan 1983 ano
59.612
+12.04
25.31%
1 jan 1984 ano
74.57
+14.958
25.09%
1 jan 1985 ano
71.156
-3.414
-4.58%
1 jan 1986 ano
68.795
-2.36
-3.32%
1 jan 1987 ano
74.784
+5.989
8.71%
1 jan 1988 ano
68.194
-6.59
-8.81%
1 jan 1989 ano
63.374
-4.82
-7.07%
1 jan 1990 ano
66.616
+3.241
5.11%
1 jan 1991 ano
62.093
-4.522
-6.79%
1 jan 1992 ano
63.496
+1.403
2.26%
1 jan 1993 ano
67.114
+3.618
5.7%
1 jan 1994 ano
61.78
-5.335
-7.95%
1 jan 1995 ano
71.388
+9.609
15.55%
1 jan 1996 ano
76.037
+4.649
6.51%
1 jan 1997 ano
61.82
-14.217
-18.7%
1 jan 1998 ano
72.458
+10.638
17.21%
1 jan 1999 ano
71.058
-1.4
-1.93%
1 jan 2000 ano
64.204
-6.854
-9.65%
1 jan 2001 ano
56.095
-8.109
-12.63%
1 jan 2002 ano
64.954
+8.859
15.79%
1 jan 2003 ano
59.988
-4.966
-7.65%
1 jan 2004 ano
59.065
-0.924
-1.54%
1 jan 2005 ano
64.704
+5.64
9.55%
1 jan 2006 ano
51.159
-13.545
-20.93%
1 jan 2007 ano
51.615
+0.456
0.89%
1 jan 2008 ano
50.307
-1.308
-2.53%
1 jan 2009 ano
50.316
+0.009
0.02%
1 jan 2010 ano
53.384
+3.068
6.1%
1 jan 2011 ano
49.811
-3.573
-6.69%
Classificação de países por estatísticas atuais por anos


Comentários: