29
/pt/
pt
AIzaSyAYiBZKx7MnpbEhh9jyipgxe19OcubqV5w
April 1, 2024
142580
Greenland
GRL
true
2
1
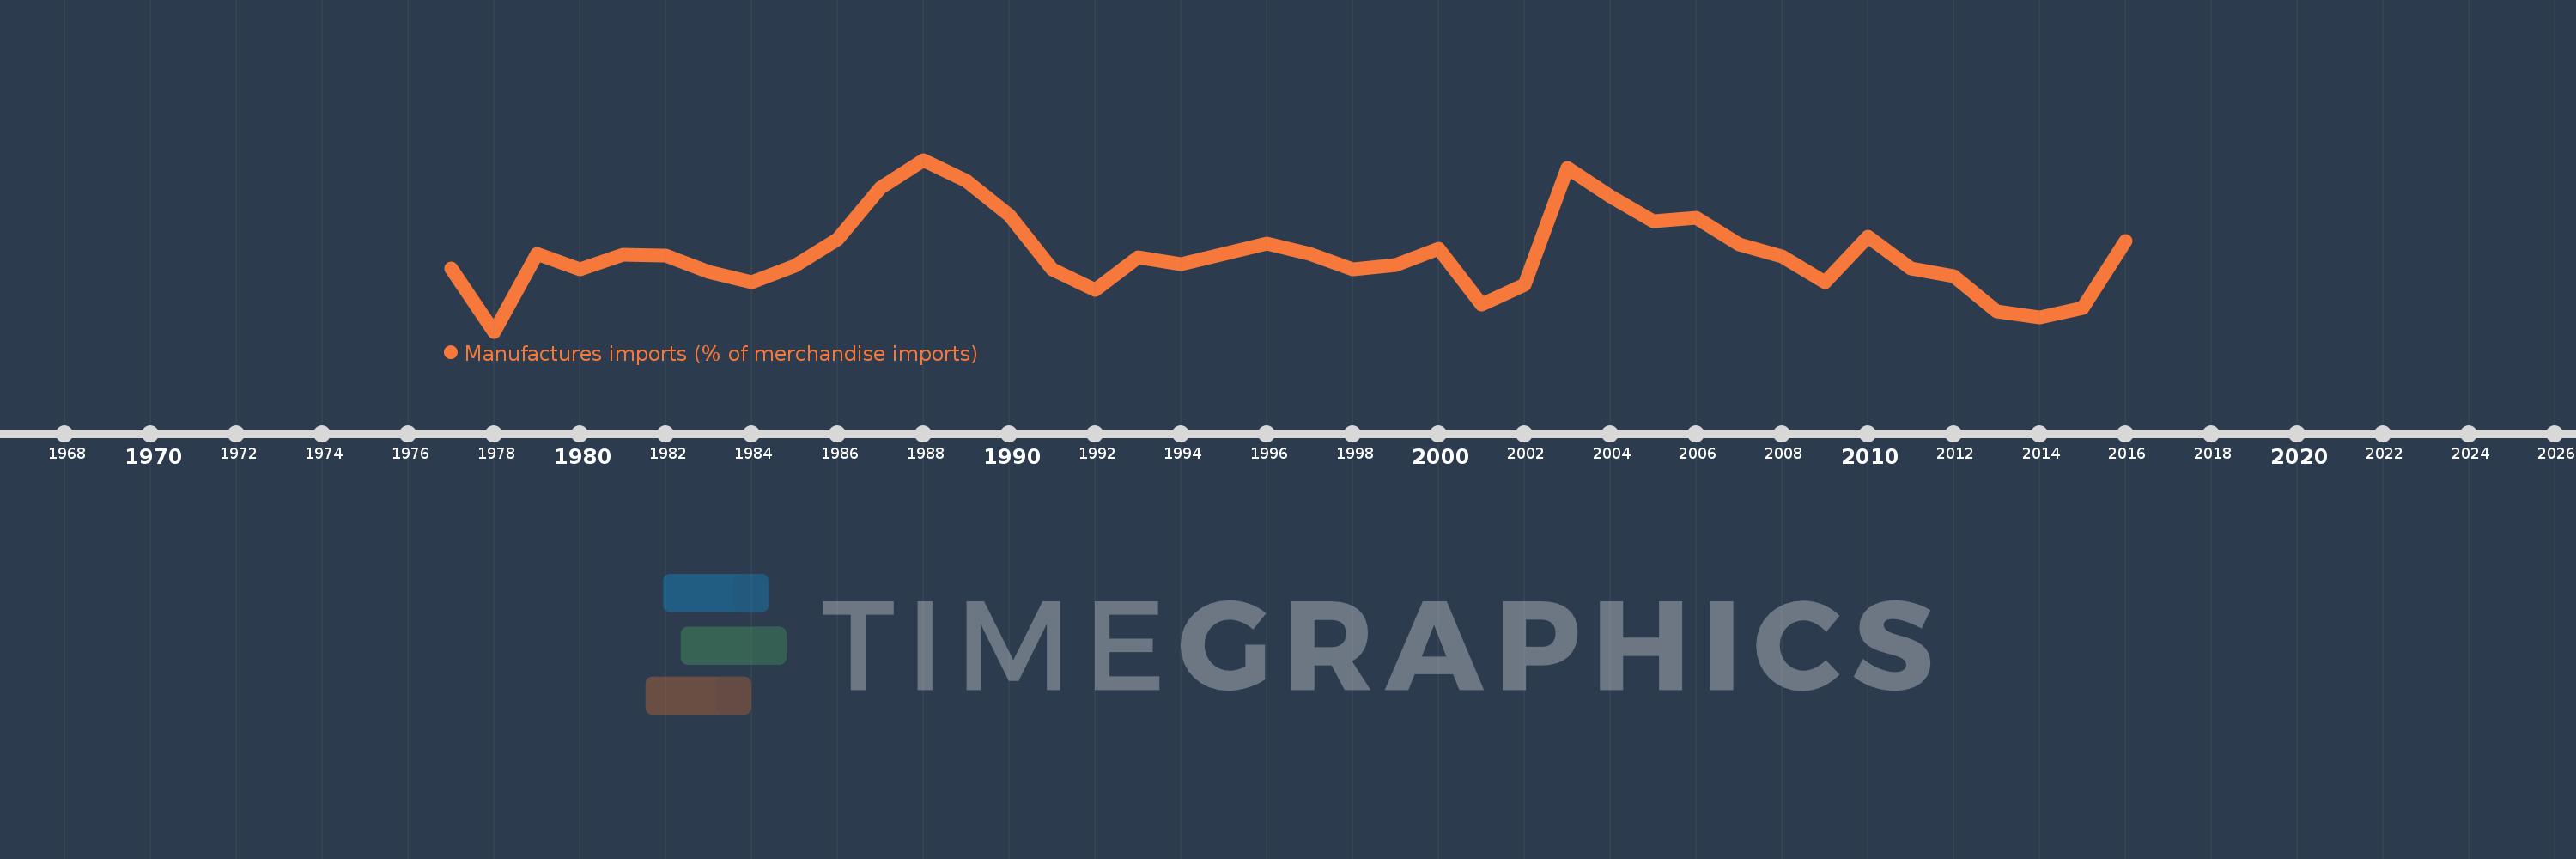
Manufactures imports (% of merchandise imports)
2016,2015,2014,2013,2012,2011,2010,2009,2008,2007,2006,2005,2004,2003,2002,2001,2000,1999,1998,1997,1996,1994,1993,1992,1991,1990,1989,1988,1987,1986,1985,1984,1983,1982,1981,1980,1979,1978,1977
Estas estatísticas em outros países:
AfghanistanAlbaniaAlgeriaAndorraAngolaAntigua and BarbudaArab WorldArgentinaArmeniaArubaAustraliaAustriaAzerbaijanBahamas, TheBahrainBangladeshBarbadosBelarusBelgiumBelizeBeninBermudaBhutanBoliviaBosnia and HerzegovinaBotswanaBrazilBrunei DarussalamBulgariaBurkina FasoBurundiCabo VerdeCambodiaCameroonCanadaCaribbean small statesCayman IslandsCentral African RepublicCentral Europe and the BalticsChadChileChinaColombiaComorosCongo, Dem. Rep.Congo, Rep.Costa RicaCote d'IvoireCroatiaCubaCyprusCzech RepublicDenmarkDjiboutiDominicaDominican RepublicEarly-demographic dividendEast Asia & PacificEast Asia & Pacific (excluding high income)East Asia & Pacific (IDA & IBRD countries)EcuadorEgypt, Arab Rep.El SalvadorEquatorial GuineaEritreaEstoniaEthiopiaEuro areaEurope & Central AsiaEurope & Central Asia (excluding high income)Europe & Central Asia (IDA & IBRD countries)European UnionFaroe IslandsFijiFinlandFragile and conflict affected situationsFranceFrench PolynesiaGabonGambia, TheGeorgiaGermanyGhanaGreeceGreenlandGrenadaGuatemalaGuineaGuinea-BissauGuyanaHaitiHeavily indebted poor countries (HIPC)High incomeHondurasHong Kong SAR, ChinaHungaryIBRD onlyIcelandIDA & IBRD totalIDA blendIDA onlyIDA totalIndiaIndonesiaIran, Islamic Rep.IraqIrelandIsraelItalyJamaicaJapanJordanKazakhstanKenyaKiribatiKorea, Rep.KuwaitKyrgyz RepublicLao PDRLate-demographic dividendLatin America & Caribbean Latin America & Caribbean (excluding high income)Latin America & the Caribbean (IDA & IBRD countries)LatviaLeast developed countries: UN classificationLebanonLesothoLiberiaLibyaLithuaniaLow & middle incomeLow incomeLower middle incomeLuxembourgMacao SAR, ChinaMacedonia, FYRMadagascarMalawiMalaysiaMaldivesMaliMaltaMauritaniaMauritiusMexicoMiddle East & North AfricaMiddle East & North Africa (excluding high income)Middle East & North Africa (IDA & IBRD countries)Middle incomeMoldovaMongoliaMoroccoMozambiqueMyanmarNamibiaNepalNetherlandsNew CaledoniaNew ZealandNicaraguaNigerNigeriaNorth AmericaNorwayOECD membersOmanOther small statesPacific island small statesPakistanPalauPanamaPapua New GuineaParaguayPeruPhilippinesPolandPortugalPost-demographic dividendPre-demographic dividendQatarRomaniaRussian FederationRwandaSamoaSao Tome and PrincipeSaudi ArabiaSenegalSerbiaSeychellesSierra LeoneSingaporeSlovak RepublicSloveniaSmall statesSolomon IslandsSomaliaSouth AfricaSouth AsiaSouth Asia (IDA & IBRD)SpainSri LankaSt. Kitts and NevisSt. LuciaSt. Vincent and the GrenadinesSub-Saharan Africa Sub-Saharan Africa (excluding high income)Sub-Saharan Africa (IDA & IBRD countries)SudanSurinameSwazilandSwedenSwitzerlandSyrian Arab RepublicTajikistanTanzaniaThailandTimor-LesteTogoTongaTrinidad and TobagoTunisiaTurkeyTurkmenistanTurks and Caicos IslandsTuvaluUgandaUkraineUnited Arab EmiratesUnited KingdomUnited StatesUpper middle incomeUruguayVanuatuVenezuela, RBVietnamVirgin Islands (U.S.)WorldYemen, Rep.ZambiaZimbabwe Linha do tempo:
Nesta escala de tempo está apresentado um gráfico de 1977 ano até 2016 ano Greenland. Dados de 1976 ano ausente. O número de observações reais por data: 39.
Fonte (nome):
Indicadores de desenvolvimento mundial
Fonte (organização):
World Bank staff estimates from the Comtrade database maintained by the United Nations Statistics Division.
Categorias:
Private Sector, Trade
Foi atualizado:
23 abr 2017 ano
Indicadores de alterações dos valores ao longo dos anos
Mínimo:
48.526
1 jan 1978 ano
Máximo:
69.497
1 jan 1988 ano
Na data de observação
Valor
Mudança absoluta
A alteração em relação ao valor anterior
1 jan 1977 ano
56.187
+56.187
0.0%
1 jan 1978 ano
48.526
-7.661
-13.64%
1 jan 1979 ano
58.017
+9.491
19.56%
1 jan 1980 ano
56.085
-1.932
-3.33%
1 jan 1981 ano
57.885
+1.8
3.21%
1 jan 1982 ano
57.856
-0.028
-0.05%
1 jan 1983 ano
55.765
-2.091
-3.61%
1 jan 1984 ano
54.571
-1.194
-2.14%
1 jan 1985 ano
56.568
+1.997
3.66%
1 jan 1986 ano
59.815
+3.247
5.74%
1 jan 1987 ano
66.056
+6.242
10.44%
1 jan 1988 ano
69.497
+3.44
5.21%
1 jan 1989 ano
66.933
-2.564
-3.69%
1 jan 1990 ano
62.762
-4.171
-6.23%
1 jan 1991 ano
56.114
-6.648
-10.59%
1 jan 1992 ano
53.609
-2.505
-4.46%
1 jan 1993 ano
57.608
+3.999
7.46%
1 jan 1994 ano
56.78
-0.828
-1.44%
1 jan 1996 ano
59.222
+2.442
4.3%
1 jan 1997 ano
58.066
-1.156
-1.95%
1 jan 1998 ano
56.109
-1.958
-3.37%
1 jan 1999 ano
56.665
+0.557
0.99%
1 jan 2000 ano
58.666
+2.001
3.53%
1 jan 2001 ano
51.791
-6.875
-11.72%
1 jan 2002 ano
54.218
+2.427
4.69%
1 jan 2003 ano
68.505
+14.287
26.35%
1 jan 2004 ano
65.069
-3.435
-5.01%
1 jan 2005 ano
61.959
-3.11
-4.78%
1 jan 2006 ano
62.401
+0.442
0.71%
1 jan 2007 ano
59.183
-3.218
-5.16%
1 jan 2008 ano
57.65
-1.533
-2.59%
1 jan 2009 ano
54.556
-3.094
-5.37%
1 jan 2010 ano
60.137
+5.581
10.23%
1 jan 2011 ano
56.216
-3.921
-6.52%
1 jan 2012 ano
55.331
-0.885
-1.57%
1 jan 2013 ano
50.996
-4.335
-7.83%
1 jan 2014 ano
50.292
-0.704
-1.38%
1 jan 2015 ano
51.417
+1.125
2.24%
1 jan 2016 ano
59.602
+8.185
15.92%
Classificação de países por estatísticas atuais por anos


Comentários: