29
/pt/
pt
AIzaSyAYiBZKx7MnpbEhh9jyipgxe19OcubqV5w
April 1, 2024
209529
New Zealand
NZL
true
2
1
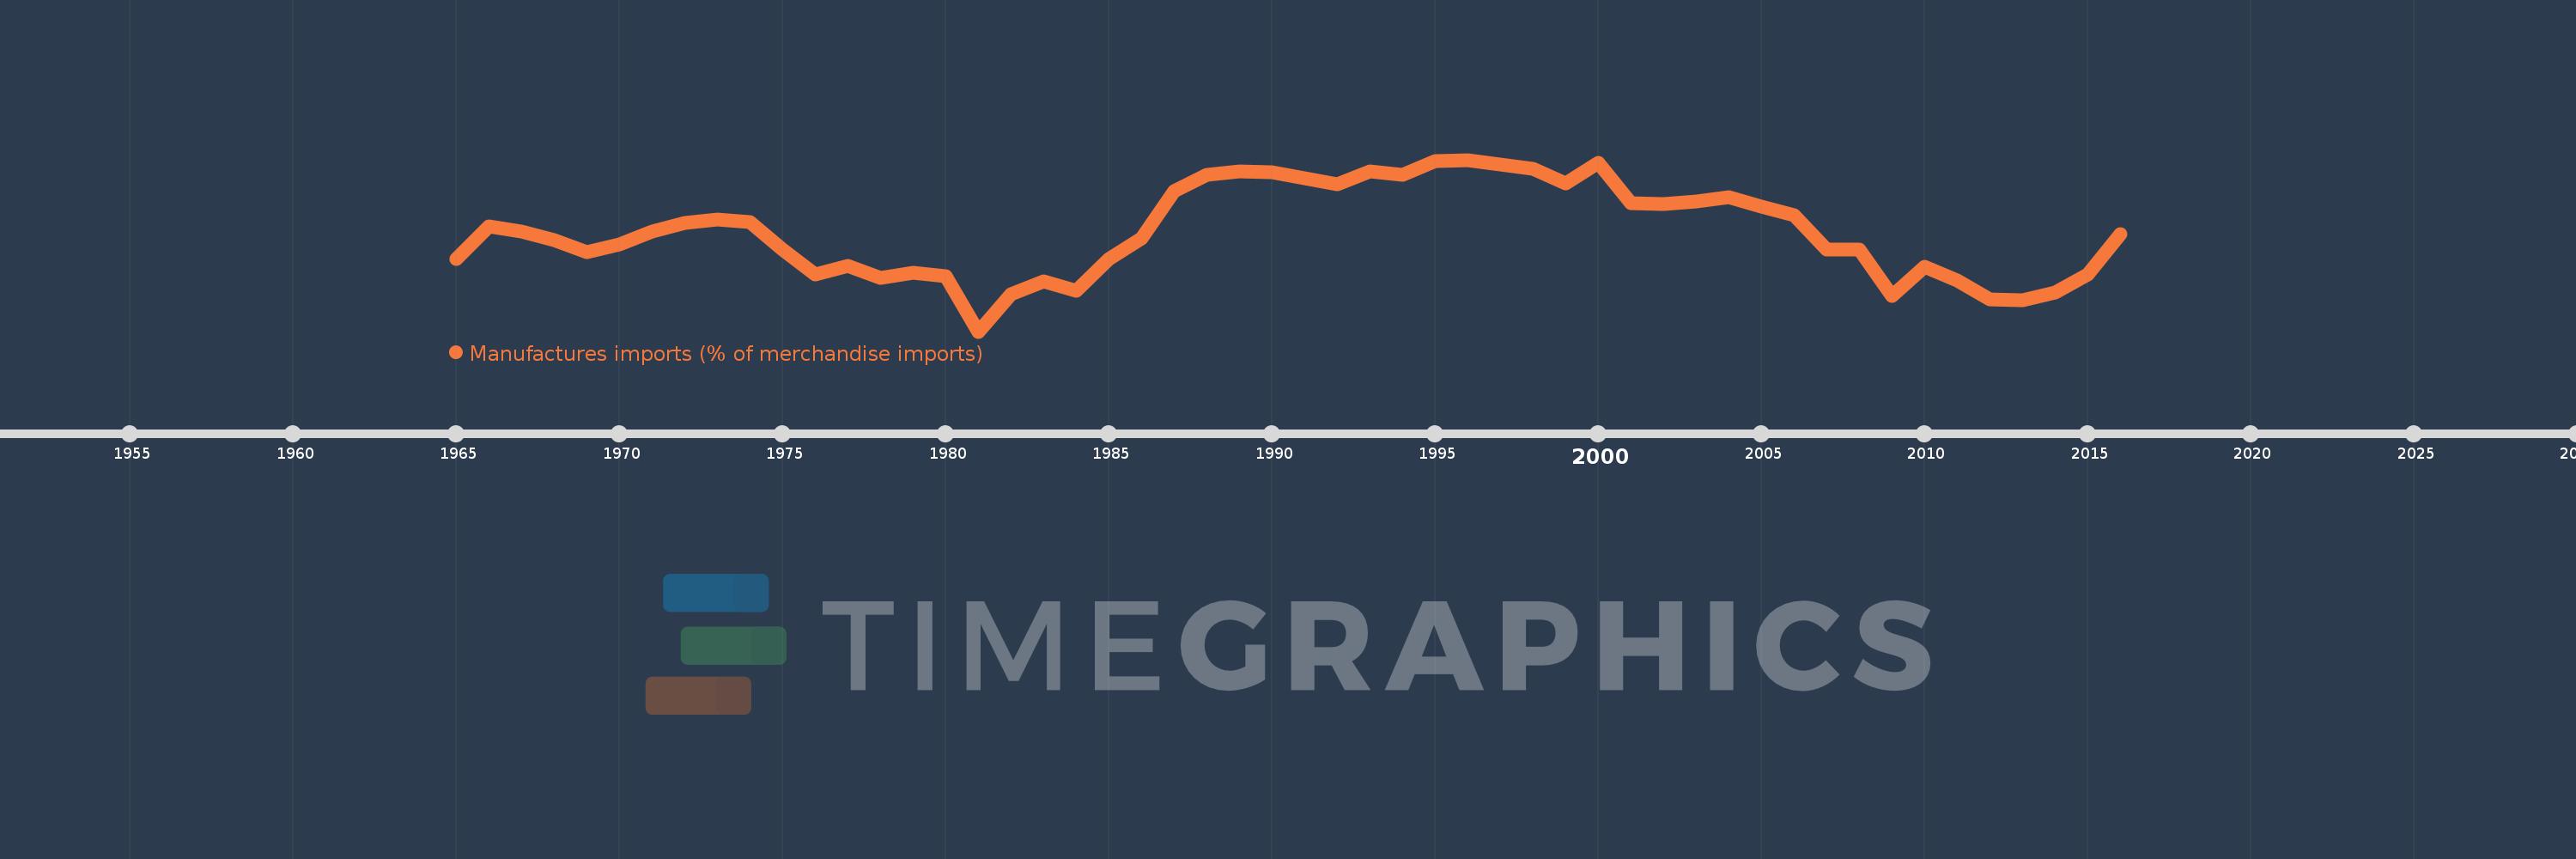
Manufactures imports (% of merchandise imports)
2016,2015,2014,2013,2012,2011,2010,2009,2008,2007,2006,2005,2004,2003,2002,2001,2000,1999,1998,1997,1996,1995,1994,1993,1992,1991,1990,1989,1988,1987,1986,1985,1984,1983,1982,1981,1980,1979,1978,1977,1976,1975,1974,1973,1972,1971,1970,1969,1968,1967,1966,1965
Estas estatísticas em outros países:
AfghanistanAlbaniaAlgeriaAndorraAngolaAntigua and BarbudaArab WorldArgentinaArmeniaArubaAustraliaAustriaAzerbaijanBahamas, TheBahrainBangladeshBarbadosBelarusBelgiumBelizeBeninBermudaBhutanBoliviaBosnia and HerzegovinaBotswanaBrazilBrunei DarussalamBulgariaBurkina FasoBurundiCabo VerdeCambodiaCameroonCanadaCaribbean small statesCayman IslandsCentral African RepublicCentral Europe and the BalticsChadChileChinaColombiaComorosCongo, Dem. Rep.Congo, Rep.Costa RicaCote d'IvoireCroatiaCubaCyprusCzech RepublicDenmarkDjiboutiDominicaDominican RepublicEarly-demographic dividendEast Asia & PacificEast Asia & Pacific (excluding high income)East Asia & Pacific (IDA & IBRD countries)EcuadorEgypt, Arab Rep.El SalvadorEquatorial GuineaEritreaEstoniaEthiopiaEuro areaEurope & Central AsiaEurope & Central Asia (excluding high income)Europe & Central Asia (IDA & IBRD countries)European UnionFaroe IslandsFijiFinlandFragile and conflict affected situationsFranceFrench PolynesiaGabonGambia, TheGeorgiaGermanyGhanaGreeceGreenlandGrenadaGuatemalaGuineaGuinea-BissauGuyanaHaitiHeavily indebted poor countries (HIPC)High incomeHondurasHong Kong SAR, ChinaHungaryIBRD onlyIcelandIDA & IBRD totalIDA blendIDA onlyIDA totalIndiaIndonesiaIran, Islamic Rep.IraqIrelandIsraelItalyJamaicaJapanJordanKazakhstanKenyaKiribatiKorea, Rep.KuwaitKyrgyz RepublicLao PDRLate-demographic dividendLatin America & Caribbean Latin America & Caribbean (excluding high income)Latin America & the Caribbean (IDA & IBRD countries)LatviaLeast developed countries: UN classificationLebanonLesothoLiberiaLibyaLithuaniaLow & middle incomeLow incomeLower middle incomeLuxembourgMacao SAR, ChinaMacedonia, FYRMadagascarMalawiMalaysiaMaldivesMaliMaltaMauritaniaMauritiusMexicoMiddle East & North AfricaMiddle East & North Africa (excluding high income)Middle East & North Africa (IDA & IBRD countries)Middle incomeMoldovaMongoliaMoroccoMozambiqueMyanmarNamibiaNepalNetherlandsNew CaledoniaNew ZealandNicaraguaNigerNigeriaNorth AmericaNorwayOECD membersOmanOther small statesPacific island small statesPakistanPalauPanamaPapua New GuineaParaguayPeruPhilippinesPolandPortugalPost-demographic dividendPre-demographic dividendQatarRomaniaRussian FederationRwandaSamoaSao Tome and PrincipeSaudi ArabiaSenegalSerbiaSeychellesSierra LeoneSingaporeSlovak RepublicSloveniaSmall statesSolomon IslandsSomaliaSouth AfricaSouth AsiaSouth Asia (IDA & IBRD)SpainSri LankaSt. Kitts and NevisSt. LuciaSt. Vincent and the GrenadinesSub-Saharan Africa Sub-Saharan Africa (excluding high income)Sub-Saharan Africa (IDA & IBRD countries)SudanSurinameSwazilandSwedenSwitzerlandSyrian Arab RepublicTajikistanTanzaniaThailandTimor-LesteTogoTongaTrinidad and TobagoTunisiaTurkeyTurkmenistanTurks and Caicos IslandsTuvaluUgandaUkraineUnited Arab EmiratesUnited KingdomUnited StatesUpper middle incomeUruguayVanuatuVenezuela, RBVietnamVirgin Islands (U.S.)WorldYemen, Rep.ZambiaZimbabwe Linha do tempo:
Nesta escala de tempo está apresentado um gráfico de 1965 ano até 2016 ano New Zealand. Dados de 1964 ano ausente. O número de observações reais por data: 52.
Fonte (nome):
Indicadores de desenvolvimento mundial
Fonte (organização):
World Bank staff estimates from the Comtrade database maintained by the United Nations Statistics Division.
Categorias:
Private Sector, Trade
Foi atualizado:
23 abr 2017 ano
Indicadores de alterações dos valores ao longo dos anos
Mínimo:
65.321
1 jan 1981 ano
Máximo:
83.316
1 jan 1996 ano
Na data de observação
Valor
Mudança absoluta
A alteração em relação ao valor anterior
1 jan 1965 ano
72.935
+72.935
0.0%
1 jan 1966 ano
76.385
+3.45
4.73%
1 jan 1967 ano
75.78
-0.605
-0.79%
1 jan 1968 ano
74.928
-0.852
-1.12%
1 jan 1969 ano
73.615
-1.313
-1.75%
1 jan 1970 ano
74.484
+0.869
1.18%
1 jan 1971 ano
75.822
+1.338
1.8%
1 jan 1972 ano
76.746
+0.925
1.22%
1 jan 1973 ano
77.064
+0.318
0.41%
1 jan 1974 ano
76.836
-0.228
-0.3%
1 jan 1975 ano
73.872
-2.964
-3.86%
1 jan 1976 ano
71.311
-2.561
-3.47%
1 jan 1977 ano
72.225
+0.915
1.28%
1 jan 1978 ano
70.928
-1.298
-1.8%
1 jan 1979 ano
71.485
+0.558
0.79%
1 jan 1980 ano
71.104
-0.381
-0.53%
1 jan 1981 ano
65.321
-5.783
-8.13%
1 jan 1982 ano
69.191
+3.869
5.92%
1 jan 1983 ano
70.606
+1.416
2.05%
1 jan 1984 ano
69.614
-0.992
-1.41%
1 jan 1985 ano
72.892
+3.278
4.71%
1 jan 1986 ano
75.087
+2.195
3.01%
1 jan 1987 ano
80.001
+4.914
6.54%
1 jan 1988 ano
81.752
+1.75
2.19%
1 jan 1989 ano
82.124
+0.372
0.46%
1 jan 1990 ano
82.012
-0.112
-0.14%
1 jan 1991 ano
81.424
-0.588
-0.72%
1 jan 1992 ano
80.788
-0.635
-0.78%
1 jan 1993 ano
82.07
+1.282
1.59%
1 jan 1994 ano
81.726
-0.345
-0.42%
1 jan 1995 ano
83.165
+1.44
1.76%
1 jan 1996 ano
83.316
+0.151
0.18%
1 jan 1997 ano
82.794
-0.522
-0.63%
1 jan 1998 ano
82.386
-0.408
-0.49%
1 jan 1999 ano
80.856
-1.53
-1.86%
1 jan 2000 ano
82.976
+2.121
2.62%
1 jan 2001 ano
78.747
-4.229
-5.1%
1 jan 2002 ano
78.697
-0.05
-0.06%
1 jan 2003 ano
78.93
+0.233
0.3%
1 jan 2004 ano
79.371
+0.441
0.56%
1 jan 2005 ano
78.38
-0.991
-1.25%
1 jan 2006 ano
77.502
-0.878
-1.12%
1 jan 2007 ano
73.912
-3.59
-4.63%
1 jan 2008 ano
73.887
-0.026
-0.03%
1 jan 2009 ano
69.028
-4.858
-6.58%
1 jan 2010 ano
72.077
+3.048
4.42%
1 jan 2011 ano
70.672
-1.405
-1.95%
1 jan 2012 ano
68.736
-1.936
-2.74%
1 jan 2013 ano
68.619
-0.117
-0.17%
1 jan 2014 ano
69.424
+0.805
1.17%
1 jan 2015 ano
71.332
+1.908
2.75%
1 jan 2016 ano
75.535
+4.202
5.89%
Classificação de países por estatísticas atuais por anos


Comentários: