29
/pt/
pt
AIzaSyAYiBZKx7MnpbEhh9jyipgxe19OcubqV5w
April 1, 2024
232423
Samoa
WSM
true
2
1
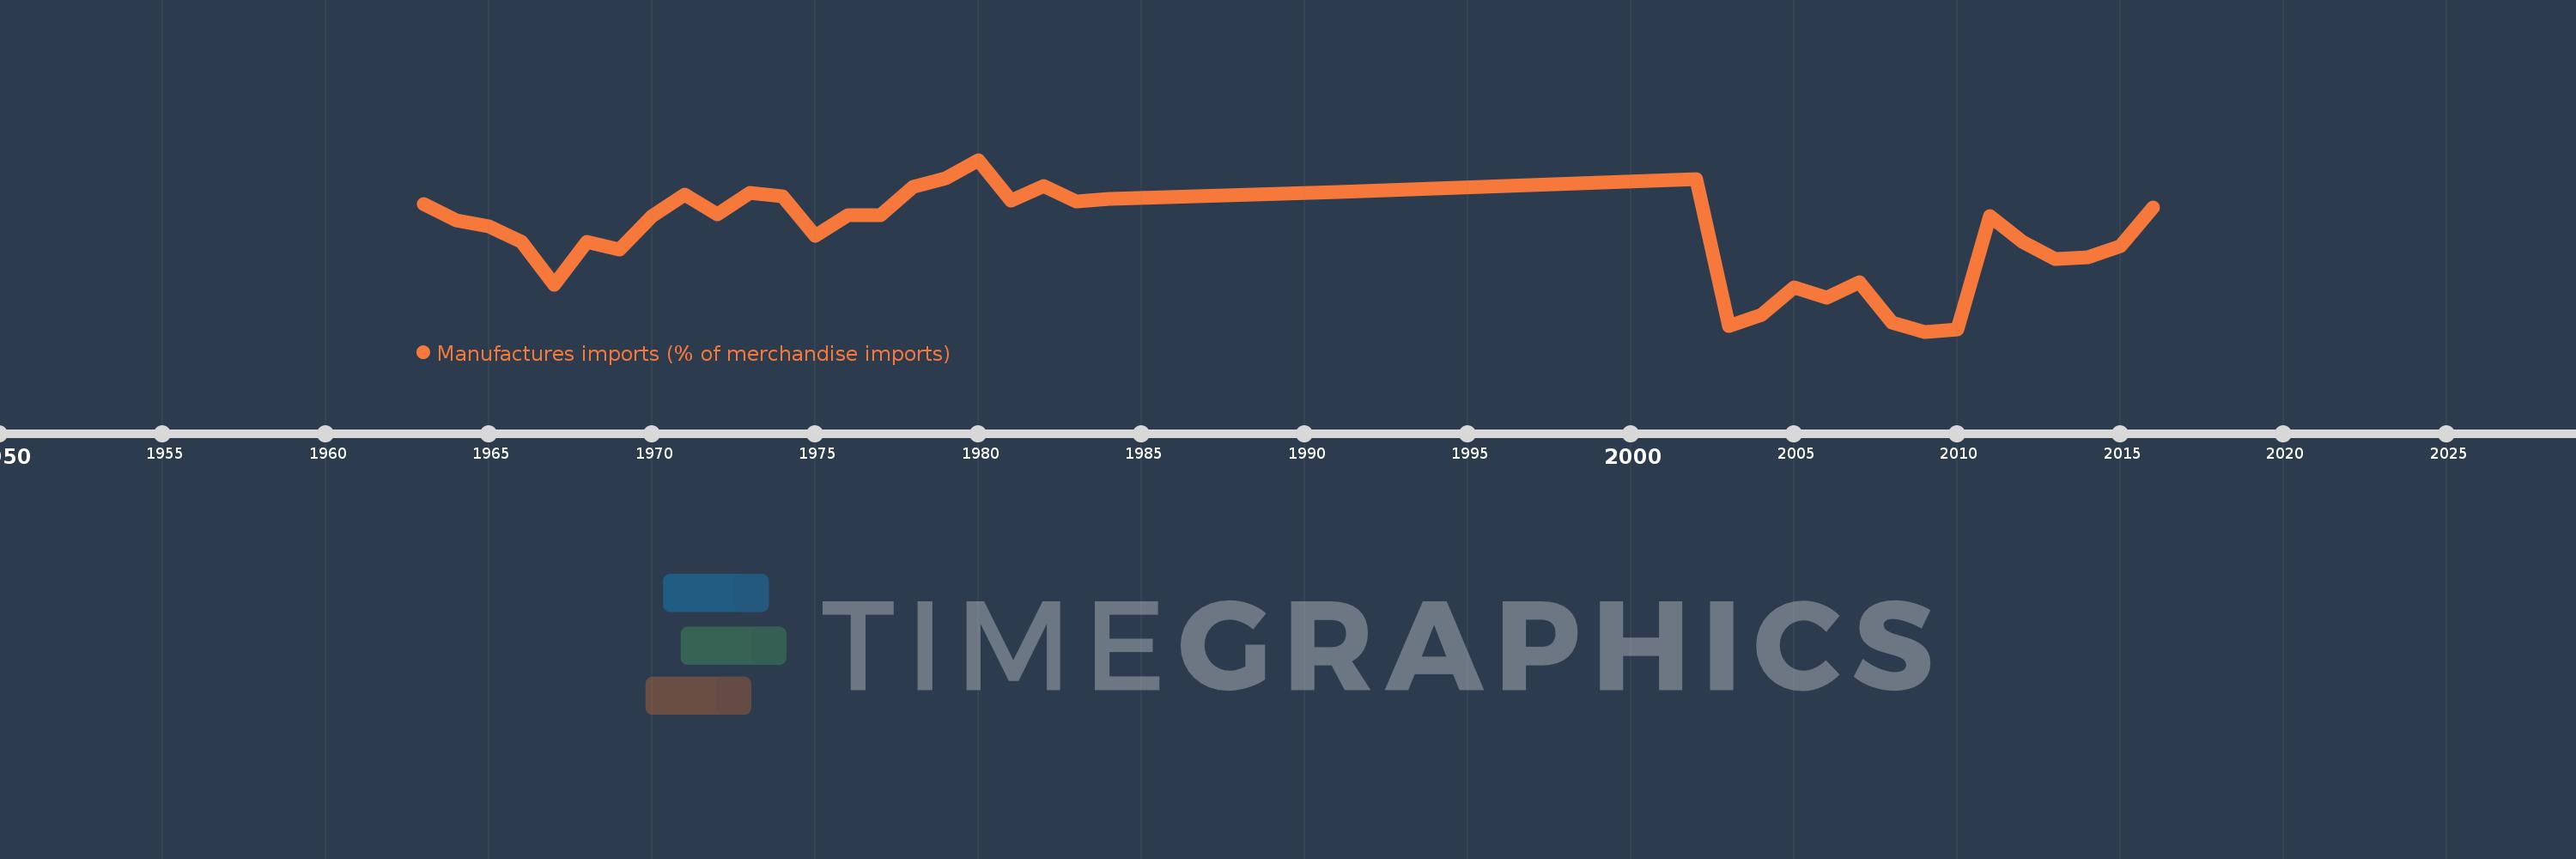
Manufactures imports (% of merchandise imports)
2016,2015,2014,2013,2012,2011,2010,2009,2008,2007,2006,2005,2004,2003,2002,1991,1984,1983,1982,1981,1980,1979,1978,1977,1976,1975,1974,1973,1972,1971,1970,1969,1968,1967,1966,1965,1964,1963
Estas estatísticas em outros países:
AfghanistanAlbaniaAlgeriaAndorraAngolaAntigua and BarbudaArab WorldArgentinaArmeniaArubaAustraliaAustriaAzerbaijanBahamas, TheBahrainBangladeshBarbadosBelarusBelgiumBelizeBeninBermudaBhutanBoliviaBosnia and HerzegovinaBotswanaBrazilBrunei DarussalamBulgariaBurkina FasoBurundiCabo VerdeCambodiaCameroonCanadaCaribbean small statesCayman IslandsCentral African RepublicCentral Europe and the BalticsChadChileChinaColombiaComorosCongo, Dem. Rep.Congo, Rep.Costa RicaCote d'IvoireCroatiaCubaCyprusCzech RepublicDenmarkDjiboutiDominicaDominican RepublicEarly-demographic dividendEast Asia & PacificEast Asia & Pacific (excluding high income)East Asia & Pacific (IDA & IBRD countries)EcuadorEgypt, Arab Rep.El SalvadorEquatorial GuineaEritreaEstoniaEthiopiaEuro areaEurope & Central AsiaEurope & Central Asia (excluding high income)Europe & Central Asia (IDA & IBRD countries)European UnionFaroe IslandsFijiFinlandFragile and conflict affected situationsFranceFrench PolynesiaGabonGambia, TheGeorgiaGermanyGhanaGreeceGreenlandGrenadaGuatemalaGuineaGuinea-BissauGuyanaHaitiHeavily indebted poor countries (HIPC)High incomeHondurasHong Kong SAR, ChinaHungaryIBRD onlyIcelandIDA & IBRD totalIDA blendIDA onlyIDA totalIndiaIndonesiaIran, Islamic Rep.IraqIrelandIsraelItalyJamaicaJapanJordanKazakhstanKenyaKiribatiKorea, Rep.KuwaitKyrgyz RepublicLao PDRLate-demographic dividendLatin America & Caribbean Latin America & Caribbean (excluding high income)Latin America & the Caribbean (IDA & IBRD countries)LatviaLeast developed countries: UN classificationLebanonLesothoLiberiaLibyaLithuaniaLow & middle incomeLow incomeLower middle incomeLuxembourgMacao SAR, ChinaMacedonia, FYRMadagascarMalawiMalaysiaMaldivesMaliMaltaMauritaniaMauritiusMexicoMiddle East & North AfricaMiddle East & North Africa (excluding high income)Middle East & North Africa (IDA & IBRD countries)Middle incomeMoldovaMongoliaMoroccoMozambiqueMyanmarNamibiaNepalNetherlandsNew CaledoniaNew ZealandNicaraguaNigerNigeriaNorth AmericaNorwayOECD membersOmanOther small statesPacific island small statesPakistanPalauPanamaPapua New GuineaParaguayPeruPhilippinesPolandPortugalPost-demographic dividendPre-demographic dividendQatarRomaniaRussian FederationRwandaSamoaSao Tome and PrincipeSaudi ArabiaSenegalSerbiaSeychellesSierra LeoneSingaporeSlovak RepublicSloveniaSmall statesSolomon IslandsSomaliaSouth AfricaSouth AsiaSouth Asia (IDA & IBRD)SpainSri LankaSt. Kitts and NevisSt. LuciaSt. Vincent and the GrenadinesSub-Saharan Africa Sub-Saharan Africa (excluding high income)Sub-Saharan Africa (IDA & IBRD countries)SudanSurinameSwazilandSwedenSwitzerlandSyrian Arab RepublicTajikistanTanzaniaThailandTimor-LesteTogoTongaTrinidad and TobagoTunisiaTurkeyTurkmenistanTurks and Caicos IslandsTuvaluUgandaUkraineUnited Arab EmiratesUnited KingdomUnited StatesUpper middle incomeUruguayVanuatuVenezuela, RBVietnamVirgin Islands (U.S.)WorldYemen, Rep.ZambiaZimbabwe Linha do tempo:
Nesta escala de tempo está apresentado um gráfico de 1963 ano até 2016 ano Samoa. Dados de 1962 ano ausente. O número de observações reais por data: 38.
Fonte (nome):
Indicadores de desenvolvimento mundial
Fonte (organização):
World Bank staff estimates from the Comtrade database maintained by the United Nations Statistics Division.
Categorias:
Private Sector, Trade
Foi atualizado:
23 abr 2017 ano
Indicadores de alterações dos valores ao longo dos anos
Mínimo:
31.724
1 jan 2009 ano
Máximo:
64.893
1 jan 1980 ano
Na data de observação
Valor
Mudança absoluta
A alteração em relação ao valor anterior
1 jan 1963 ano
56.395
+56.395
0.0%
1 jan 1964 ano
53.158
-3.237
-5.74%
1 jan 1965 ano
52.009
-1.149
-2.16%
1 jan 1966 ano
49.04
-2.969
-5.71%
1 jan 1967 ano
40.812
-8.228
-16.78%
1 jan 1968 ano
49.028
+8.216
20.13%
1 jan 1969 ano
47.642
-1.386
-2.83%
1 jan 1970 ano
53.956
+6.314
13.25%
1 jan 1971 ano
58.196
+4.241
7.86%
1 jan 1972 ano
54.43
-3.766
-6.47%
1 jan 1973 ano
58.579
+4.149
7.62%
1 jan 1974 ano
57.847
-0.732
-1.25%
1 jan 1975 ano
50.233
-7.615
-13.16%
1 jan 1976 ano
54.114
+3.881
7.73%
1 jan 1977 ano
54.133
+0.019
0.04%
1 jan 1978 ano
59.649
+5.516
10.19%
1 jan 1979 ano
61.313
+1.664
2.79%
1 jan 1980 ano
64.893
+3.58
5.84%
1 jan 1981 ano
57.05
-7.843
-12.09%
1 jan 1982 ano
59.89
+2.839
4.98%
1 jan 1983 ano
56.776
-3.114
-5.2%
1 jan 1984 ano
57.375
+0.6
1.06%
1 jan 1991 ano
58.749
+1.374
2.39%
1 jan 2002 ano
61.192
+2.443
4.16%
1 jan 2003 ano
32.869
-28.324
-46.29%
1 jan 2004 ano
34.928
+2.059
6.26%
1 jan 2005 ano
40.282
+5.354
15.33%
1 jan 2006 ano
38.204
-2.078
-5.16%
1 jan 2007 ano
41.207
+3.003
7.86%
1 jan 2008 ano
33.539
-7.667
-18.61%
1 jan 2009 ano
31.724
-1.816
-5.41%
1 jan 2010 ano
32.117
+0.393
1.24%
1 jan 2011 ano
54.044
+21.927
68.27%
1 jan 2012 ano
49.033
-5.011
-9.27%
1 jan 2013 ano
45.656
-3.376
-6.89%
1 jan 2014 ano
46.093
+0.436
0.96%
1 jan 2015 ano
48.199
+2.106
4.57%
1 jan 2016 ano
55.727
+7.528
15.62%
Classificação de países por estatísticas atuais por anos


Comentários: