29
/pt/
pt
AIzaSyAYiBZKx7MnpbEhh9jyipgxe19OcubqV5w
April 1, 2024
186764
Malawi
MWI
true
2
1
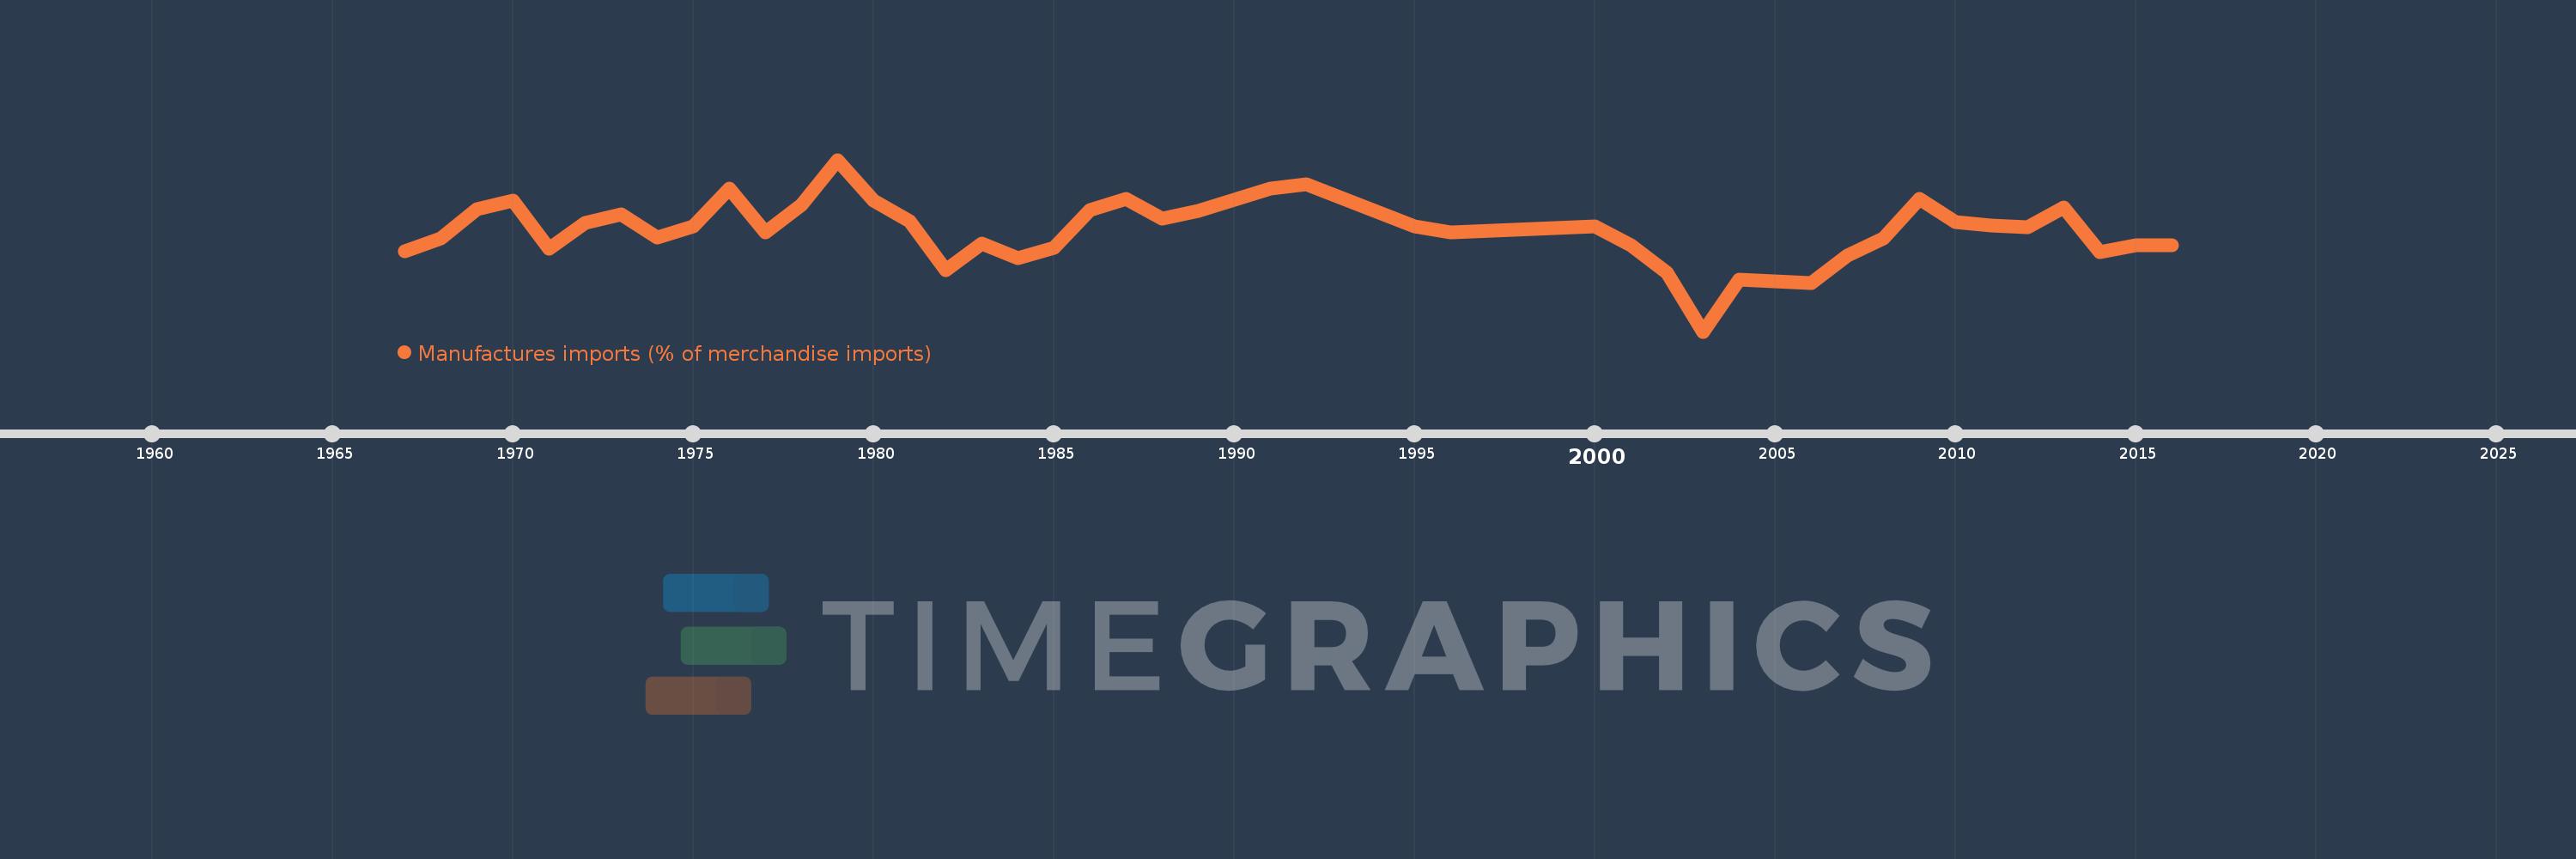
Manufactures imports (% of merchandise imports)
2016,2015,2014,2013,2012,2011,2010,2009,2008,2007,2006,2005,2004,2003,2002,2001,2000,1996,1995,1992,1991,1989,1988,1987,1986,1985,1984,1983,1982,1981,1980,1979,1978,1977,1976,1975,1974,1973,1972,1971,1970,1969,1968,1967
Estas estatísticas em outros países:
AfghanistanAlbaniaAlgeriaAndorraAngolaAntigua and BarbudaArab WorldArgentinaArmeniaArubaAustraliaAustriaAzerbaijanBahamas, TheBahrainBangladeshBarbadosBelarusBelgiumBelizeBeninBermudaBhutanBoliviaBosnia and HerzegovinaBotswanaBrazilBrunei DarussalamBulgariaBurkina FasoBurundiCabo VerdeCambodiaCameroonCanadaCaribbean small statesCayman IslandsCentral African RepublicCentral Europe and the BalticsChadChileChinaColombiaComorosCongo, Dem. Rep.Congo, Rep.Costa RicaCote d'IvoireCroatiaCubaCyprusCzech RepublicDenmarkDjiboutiDominicaDominican RepublicEarly-demographic dividendEast Asia & PacificEast Asia & Pacific (excluding high income)East Asia & Pacific (IDA & IBRD countries)EcuadorEgypt, Arab Rep.El SalvadorEquatorial GuineaEritreaEstoniaEthiopiaEuro areaEurope & Central AsiaEurope & Central Asia (excluding high income)Europe & Central Asia (IDA & IBRD countries)European UnionFaroe IslandsFijiFinlandFragile and conflict affected situationsFranceFrench PolynesiaGabonGambia, TheGeorgiaGermanyGhanaGreeceGreenlandGrenadaGuatemalaGuineaGuinea-BissauGuyanaHaitiHeavily indebted poor countries (HIPC)High incomeHondurasHong Kong SAR, ChinaHungaryIBRD onlyIcelandIDA & IBRD totalIDA blendIDA onlyIDA totalIndiaIndonesiaIran, Islamic Rep.IraqIrelandIsraelItalyJamaicaJapanJordanKazakhstanKenyaKiribatiKorea, Rep.KuwaitKyrgyz RepublicLao PDRLate-demographic dividendLatin America & Caribbean Latin America & Caribbean (excluding high income)Latin America & the Caribbean (IDA & IBRD countries)LatviaLeast developed countries: UN classificationLebanonLesothoLiberiaLibyaLithuaniaLow & middle incomeLow incomeLower middle incomeLuxembourgMacao SAR, ChinaMacedonia, FYRMadagascarMalawiMalaysiaMaldivesMaliMaltaMauritaniaMauritiusMexicoMiddle East & North AfricaMiddle East & North Africa (excluding high income)Middle East & North Africa (IDA & IBRD countries)Middle incomeMoldovaMongoliaMoroccoMozambiqueMyanmarNamibiaNepalNetherlandsNew CaledoniaNew ZealandNicaraguaNigerNigeriaNorth AmericaNorwayOECD membersOmanOther small statesPacific island small statesPakistanPalauPanamaPapua New GuineaParaguayPeruPhilippinesPolandPortugalPost-demographic dividendPre-demographic dividendQatarRomaniaRussian FederationRwandaSamoaSao Tome and PrincipeSaudi ArabiaSenegalSerbiaSeychellesSierra LeoneSingaporeSlovak RepublicSloveniaSmall statesSolomon IslandsSomaliaSouth AfricaSouth AsiaSouth Asia (IDA & IBRD)SpainSri LankaSt. Kitts and NevisSt. LuciaSt. Vincent and the GrenadinesSub-Saharan Africa Sub-Saharan Africa (excluding high income)Sub-Saharan Africa (IDA & IBRD countries)SudanSurinameSwazilandSwedenSwitzerlandSyrian Arab RepublicTajikistanTanzaniaThailandTimor-LesteTogoTongaTrinidad and TobagoTunisiaTurkeyTurkmenistanTurks and Caicos IslandsTuvaluUgandaUkraineUnited Arab EmiratesUnited KingdomUnited StatesUpper middle incomeUruguayVanuatuVenezuela, RBVietnamVirgin Islands (U.S.)WorldYemen, Rep.ZambiaZimbabwe Linha do tempo:
Nesta escala de tempo está apresentado um gráfico de 1967 ano até 2016 ano Malawi. Dados de 1966 ano ausente. O número de observações reais por data: 44.
Fonte (nome):
Indicadores de desenvolvimento mundial
Fonte (organização):
World Bank staff estimates from the Comtrade database maintained by the United Nations Statistics Division.
Categorias:
Private Sector, Trade
Foi atualizado:
23 abr 2017 ano
Indicadores de alterações dos valores ao longo dos anos
Mínimo:
63.393
1 jan 2003 ano
Máximo:
80.772
1 jan 1979 ano
Na data de observação
Valor
Mudança absoluta
A alteração em relação ao valor anterior
1 jan 1967 ano
71.507
+71.507
0.0%
1 jan 1968 ano
72.815
+1.308
1.83%
1 jan 1969 ano
75.757
+2.942
4.04%
1 jan 1970 ano
76.686
+0.929
1.23%
1 jan 1971 ano
71.742
-4.944
-6.45%
1 jan 1972 ano
74.369
+2.627
3.66%
1 jan 1973 ano
75.291
+0.922
1.24%
1 jan 1974 ano
72.916
-2.376
-3.16%
1 jan 1975 ano
74.06
+1.144
1.57%
1 jan 1976 ano
77.863
+3.803
5.14%
1 jan 1977 ano
73.465
-4.398
-5.65%
1 jan 1978 ano
76.175
+2.71
3.69%
1 jan 1979 ano
80.772
+4.596
6.03%
1 jan 1980 ano
76.651
-4.121
-5.1%
1 jan 1981 ano
74.521
-2.131
-2.78%
1 jan 1982 ano
69.601
-4.919
-6.6%
1 jan 1983 ano
72.315
+2.714
3.9%
1 jan 1984 ano
70.824
-1.491
-2.06%
1 jan 1985 ano
71.845
+1.021
1.44%
1 jan 1986 ano
75.716
+3.871
5.39%
1 jan 1987 ano
76.857
+1.141
1.51%
1 jan 1988 ano
74.787
-2.07
-2.69%
1 jan 1989 ano
75.581
+0.794
1.06%
1 jan 1991 ano
77.847
+2.267
3.0%
1 jan 1992 ano
78.259
+0.412
0.53%
1 jan 1995 ano
74.023
-4.236
-5.41%
1 jan 1996 ano
73.43
-0.592
-0.8%
1 jan 2000 ano
73.998
+0.568
0.77%
1 jan 2001 ano
72.13
-1.868
-2.52%
1 jan 2002 ano
69.312
-2.819
-3.91%
1 jan 2003 ano
63.393
-5.919
-8.54%
1 jan 2004 ano
68.63
+5.237
8.26%
1 jan 2005 ano
68.444
-0.186
-0.27%
1 jan 2006 ano
68.334
-0.11
-0.16%
1 jan 2007 ano
71.081
+2.747
4.02%
1 jan 2008 ano
72.86
+1.779
2.5%
1 jan 2009 ano
76.822
+3.962
5.44%
1 jan 2010 ano
74.462
-2.36
-3.07%
1 jan 2011 ano
74.129
-0.333
-0.45%
1 jan 2012 ano
73.935
-0.194
-0.26%
1 jan 2013 ano
75.951
+2.016
2.73%
1 jan 2014 ano
71.468
-4.483
-5.9%
1 jan 2015 ano
72.124
+0.656
0.92%
1 jan 2016 ano
72.086
-0.038
-0.05%
Classificação de países por estatísticas atuais por anos


Comentários: