29
/pt/
pt
AIzaSyAYiBZKx7MnpbEhh9jyipgxe19OcubqV5w
April 1, 2024
69372
Antigua and Barbuda
ATG
true
2
1
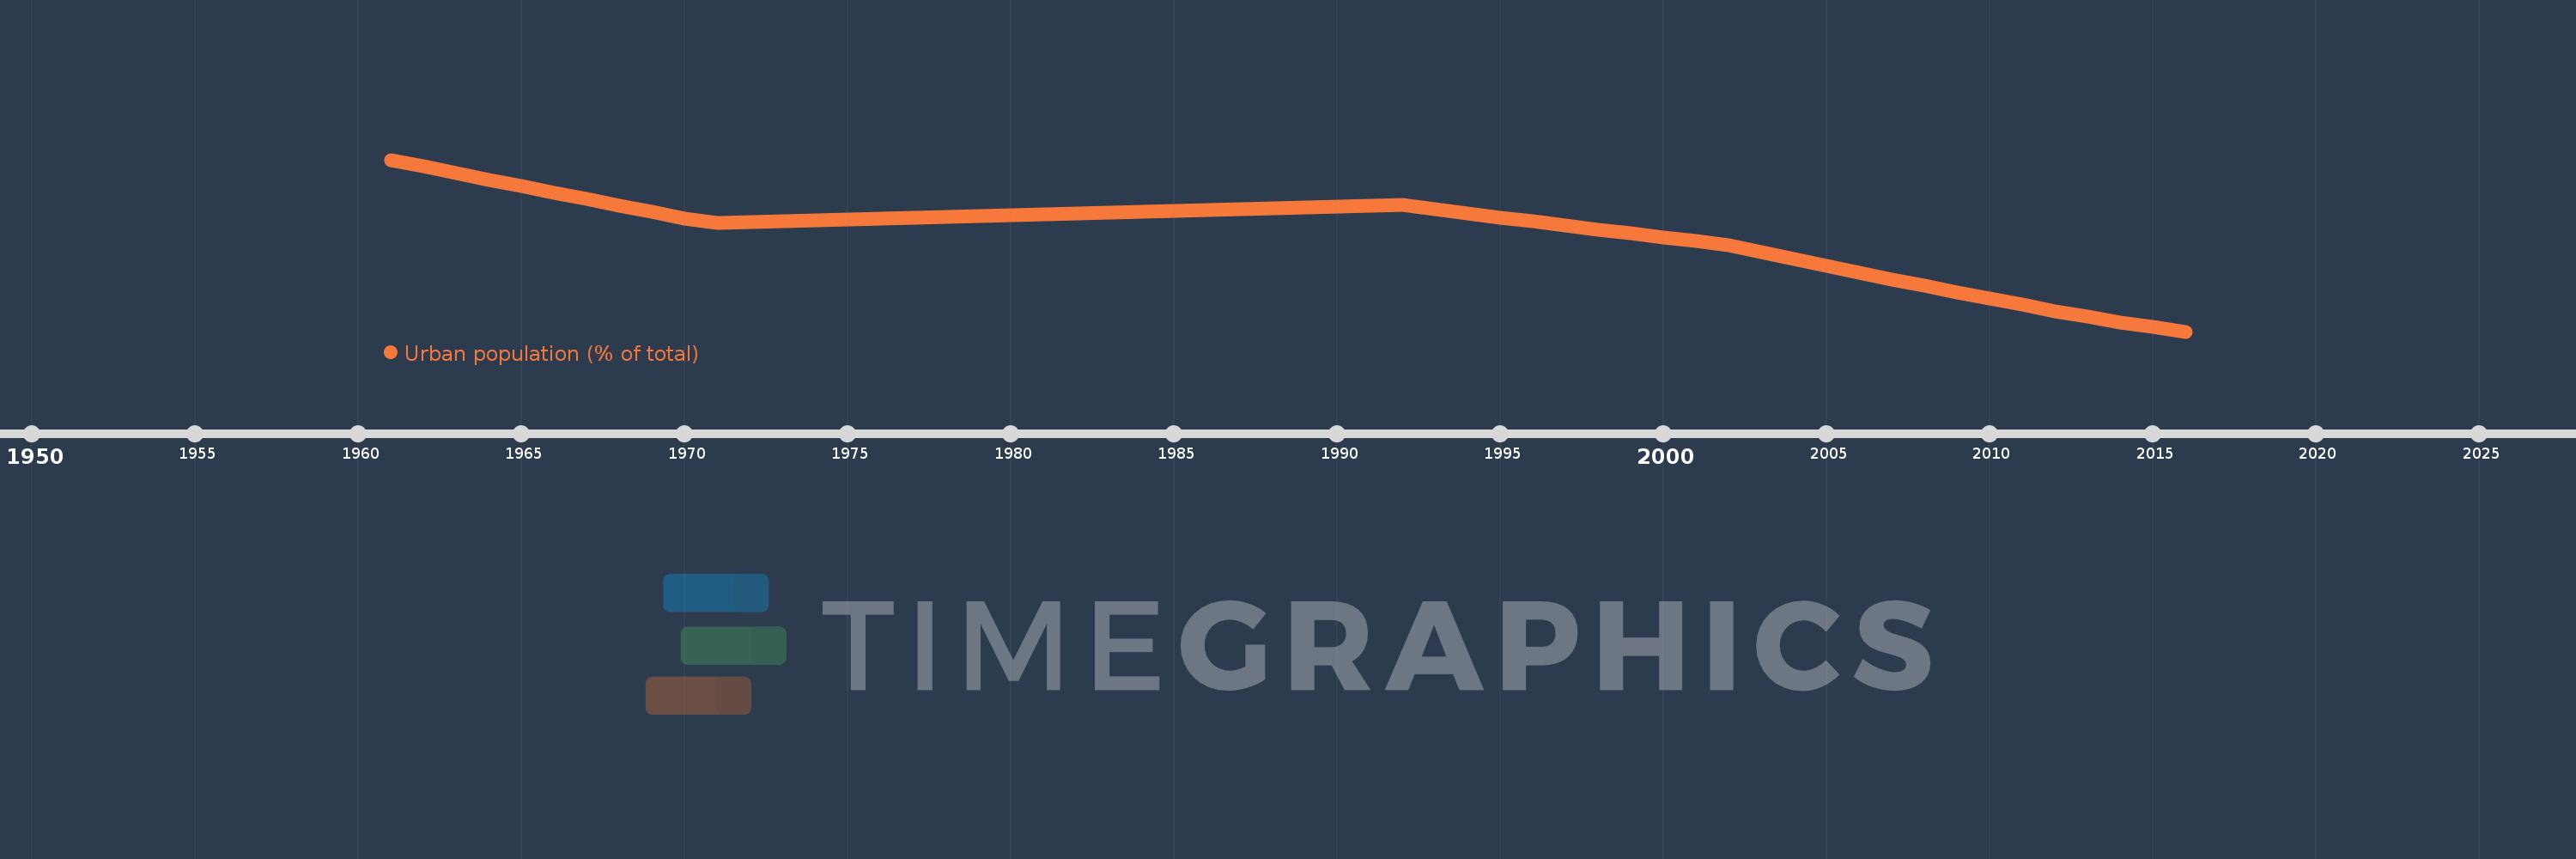
Urban population (% of total)
2016,2015,2014,2013,2012,2011,2010,2009,2008,2007,2006,2005,2004,2003,2002,2001,2000,1999,1998,1997,1996,1995,1994,1993,1992,1991,1990,1989,1988,1987,1986,1985,1984,1983,1982,1981,1980,1979,1978,1977,1976,1975,1974,1973,1972,1971,1970,1969,1968,1967,1966,1965,1964,1963,1962,1961
Estas estatísticas em outros países:
AfghanistanAlbaniaAlgeriaAmerican SamoaAndorraAngolaAntigua and BarbudaArab WorldArgentinaArmeniaArubaAustraliaAustriaAzerbaijanBahamas, TheBahrainBangladeshBarbadosBelarusBelgiumBelizeBeninBermudaBhutanBoliviaBosnia and HerzegovinaBotswanaBrazilBritish Virgin IslandsBrunei DarussalamBulgariaBurkina FasoBurundiCabo VerdeCambodiaCameroonCanadaCaribbean small statesCayman IslandsCentral African RepublicCentral Europe and the BalticsChadChannel IslandsChileChinaColombiaComorosCongo, Dem. Rep.Congo, Rep.Costa RicaCote d'IvoireCroatiaCubaCuracaoCyprusCzech RepublicDenmarkDjiboutiDominicaDominican RepublicEarly-demographic dividendEast Asia & PacificEast Asia & Pacific (excluding high income)East Asia & Pacific (IDA & IBRD countries)EcuadorEgypt, Arab Rep.El SalvadorEquatorial GuineaEritreaEstoniaEthiopiaEuro areaEurope & Central AsiaEurope & Central Asia (excluding high income)Europe & Central Asia (IDA & IBRD countries)European UnionFaroe IslandsFijiFinlandFragile and conflict affected situationsFranceFrench PolynesiaGabonGambia, TheGeorgiaGermanyGhanaGibraltarGreeceGreenlandGrenadaGuamGuatemalaGuineaGuinea-BissauGuyanaHaitiHeavily indebted poor countries (HIPC)High incomeHondurasHong Kong SAR, ChinaHungaryIBRD onlyIcelandIDA & IBRD totalIDA blendIDA onlyIDA totalIndiaIndonesiaIran, Islamic Rep.IraqIrelandIsle of ManIsraelItalyJamaicaJapanJordanKazakhstanKenyaKiribatiKorea, Dem. People’s Rep.Korea, Rep.KuwaitKyrgyz RepublicLao PDRLate-demographic dividendLatin America & Caribbean Latin America & Caribbean (excluding high income)Latin America & the Caribbean (IDA & IBRD countries)LatviaLeast developed countries: UN classificationLebanonLesothoLiberiaLibyaLiechtensteinLithuaniaLow & middle incomeLow incomeLower middle incomeLuxembourgMacao SAR, ChinaMacedonia, FYRMadagascarMalawiMalaysiaMaldivesMaliMaltaMarshall IslandsMauritaniaMauritiusMexicoMicronesia, Fed. Sts.Middle East & North AfricaMiddle East & North Africa (excluding high income)Middle East & North Africa (IDA & IBRD countries)Middle incomeMoldovaMonacoMongoliaMontenegroMoroccoMozambiqueMyanmarNamibiaNauruNepalNetherlandsNew CaledoniaNew ZealandNicaraguaNigerNigeriaNorth AmericaNorthern Mariana IslandsNorwayOECD membersOmanOther small statesPacific island small statesPakistanPalauPanamaPapua New GuineaParaguayPeruPhilippinesPolandPortugalPost-demographic dividendPre-demographic dividendPuerto RicoQatarRomaniaRussian FederationRwandaSamoaSan MarinoSao Tome and PrincipeSaudi ArabiaSenegalSerbiaSeychellesSierra LeoneSingaporeSint Maarten (Dutch part)Slovak RepublicSloveniaSmall statesSolomon IslandsSomaliaSouth AfricaSouth AsiaSouth Asia (IDA & IBRD)South SudanSpainSri LankaSt. Kitts and NevisSt. LuciaSt. Vincent and the GrenadinesSub-Saharan Africa Sub-Saharan Africa (excluding high income)Sub-Saharan Africa (IDA & IBRD countries)SudanSurinameSwazilandSwedenSwitzerlandSyrian Arab RepublicTajikistanTanzaniaThailandTimor-LesteTogoTongaTrinidad and TobagoTunisiaTurkeyTurkmenistanTurks and Caicos IslandsTuvaluUgandaUkraineUnited Arab EmiratesUnited KingdomUnited StatesUpper middle incomeUruguayUzbekistanVanuatuVenezuela, RBVietnamVirgin Islands (U.S.)West Bank and GazaWorldYemen, Rep.ZambiaZimbabwe Linha do tempo:
Nesta escala de tempo está apresentado um gráfico de 1961 ano até 2016 ano Antigua and Barbuda. Dados de 1960 ano ausente. O número de observações reais por data: 56.
Fonte (nome):
Indicadores de desenvolvimento mundial
Fonte (organização):
United Nations, World Urbanization Prospects.
Categorias:
Climate Change, Urban Development
Foi atualizado:
23 abr 2017 ano
Indicadores de alterações dos valores ao longo dos anos
Mínimo:
23.773
1 jan 2016 ano
Máximo:
39.656
1 jan 1961 ano
Na data de observação
Valor
Mudança absoluta
A alteração em relação ao valor anterior
1 jan 1961 ano
39.656
+39.656
0.0%
1 jan 1962 ano
39.04
-0.616
-1.55%
1 jan 1963 ano
38.427
-0.613
-1.57%
1 jan 1964 ano
37.817
-0.61
-1.59%
1 jan 1965 ano
37.211
-0.606
-1.6%
1 jan 1966 ano
36.61
-0.601
-1.62%
1 jan 1967 ano
36.012
-0.598
-1.63%
1 jan 1968 ano
35.418
-0.594
-1.65%
1 jan 1969 ano
34.829
-0.589
-1.66%
1 jan 1970 ano
34.245
-0.584
-1.68%
1 jan 1971 ano
33.819
-0.426
-1.24%
1 jan 1972 ano
33.898
+0.079
0.23%
1 jan 1973 ano
33.978
+0.08
0.24%
1 jan 1974 ano
34.057
+0.079
0.23%
1 jan 1975 ano
34.137
+0.08
0.23%
1 jan 1976 ano
34.217
+0.08
0.23%
1 jan 1977 ano
34.297
+0.08
0.23%
1 jan 1978 ano
34.377
+0.08
0.23%
1 jan 1979 ano
34.457
+0.08
0.23%
1 jan 1980 ano
34.538
+0.081
0.24%
1 jan 1981 ano
34.618
+0.08
0.23%
1 jan 1982 ano
34.698
+0.08
0.23%
1 jan 1983 ano
34.779
+0.081
0.23%
1 jan 1984 ano
34.86
+0.081
0.23%
1 jan 1985 ano
34.94
+0.08
0.23%
1 jan 1986 ano
35.021
+0.081
0.23%
1 jan 1987 ano
35.102
+0.081
0.23%
1 jan 1988 ano
35.183
+0.081
0.23%
1 jan 1989 ano
35.264
+0.081
0.23%
1 jan 1990 ano
35.345
+0.081
0.23%
1 jan 1991 ano
35.426
+0.081
0.23%
1 jan 1992 ano
35.465
+0.039
0.11%
1 jan 1993 ano
35.085
-0.38
-1.07%
1 jan 1994 ano
34.709
-0.376
-1.07%
1 jan 1995 ano
34.334
-0.375
-1.08%
1 jan 1996 ano
33.961
-0.373
-1.09%
1 jan 1997 ano
33.59
-0.371
-1.09%
1 jan 1998 ano
33.221
-0.369
-1.1%
1 jan 1999 ano
32.855
-0.366
-1.1%
1 jan 2000 ano
32.49
-0.365
-1.11%
1 jan 2001 ano
32.127
-0.363
-1.12%
1 jan 2002 ano
31.74
-0.387
-1.2%
1 jan 2003 ano
31.099
-0.641
-2.02%
1 jan 2004 ano
30.465
-0.634
-2.04%
1 jan 2005 ano
29.837
-0.628
-2.06%
1 jan 2006 ano
29.219
-0.618
-2.07%
1 jan 2007 ano
28.607
-0.612
-2.09%
1 jan 2008 ano
28.003
-0.604
-2.11%
1 jan 2009 ano
27.406
-0.597
-2.13%
1 jan 2010 ano
26.819
-0.587
-2.14%
1 jan 2011 ano
26.239
-0.58
-2.16%
1 jan 2012 ano
25.667
-0.572
-2.18%
1 jan 2013 ano
25.135
-0.532
-2.07%
1 jan 2014 ano
24.643
-0.492
-1.96%
1 jan 2015 ano
24.19
-0.453
-1.84%
1 jan 2016 ano
23.773
-0.417
-1.72%
Classificação de países por estatísticas atuais por anos


Comentários: