29
/pt/
pt
AIzaSyAYiBZKx7MnpbEhh9jyipgxe19OcubqV5w
April 1, 2024
37094
IBRD only
IBD
false
2
1
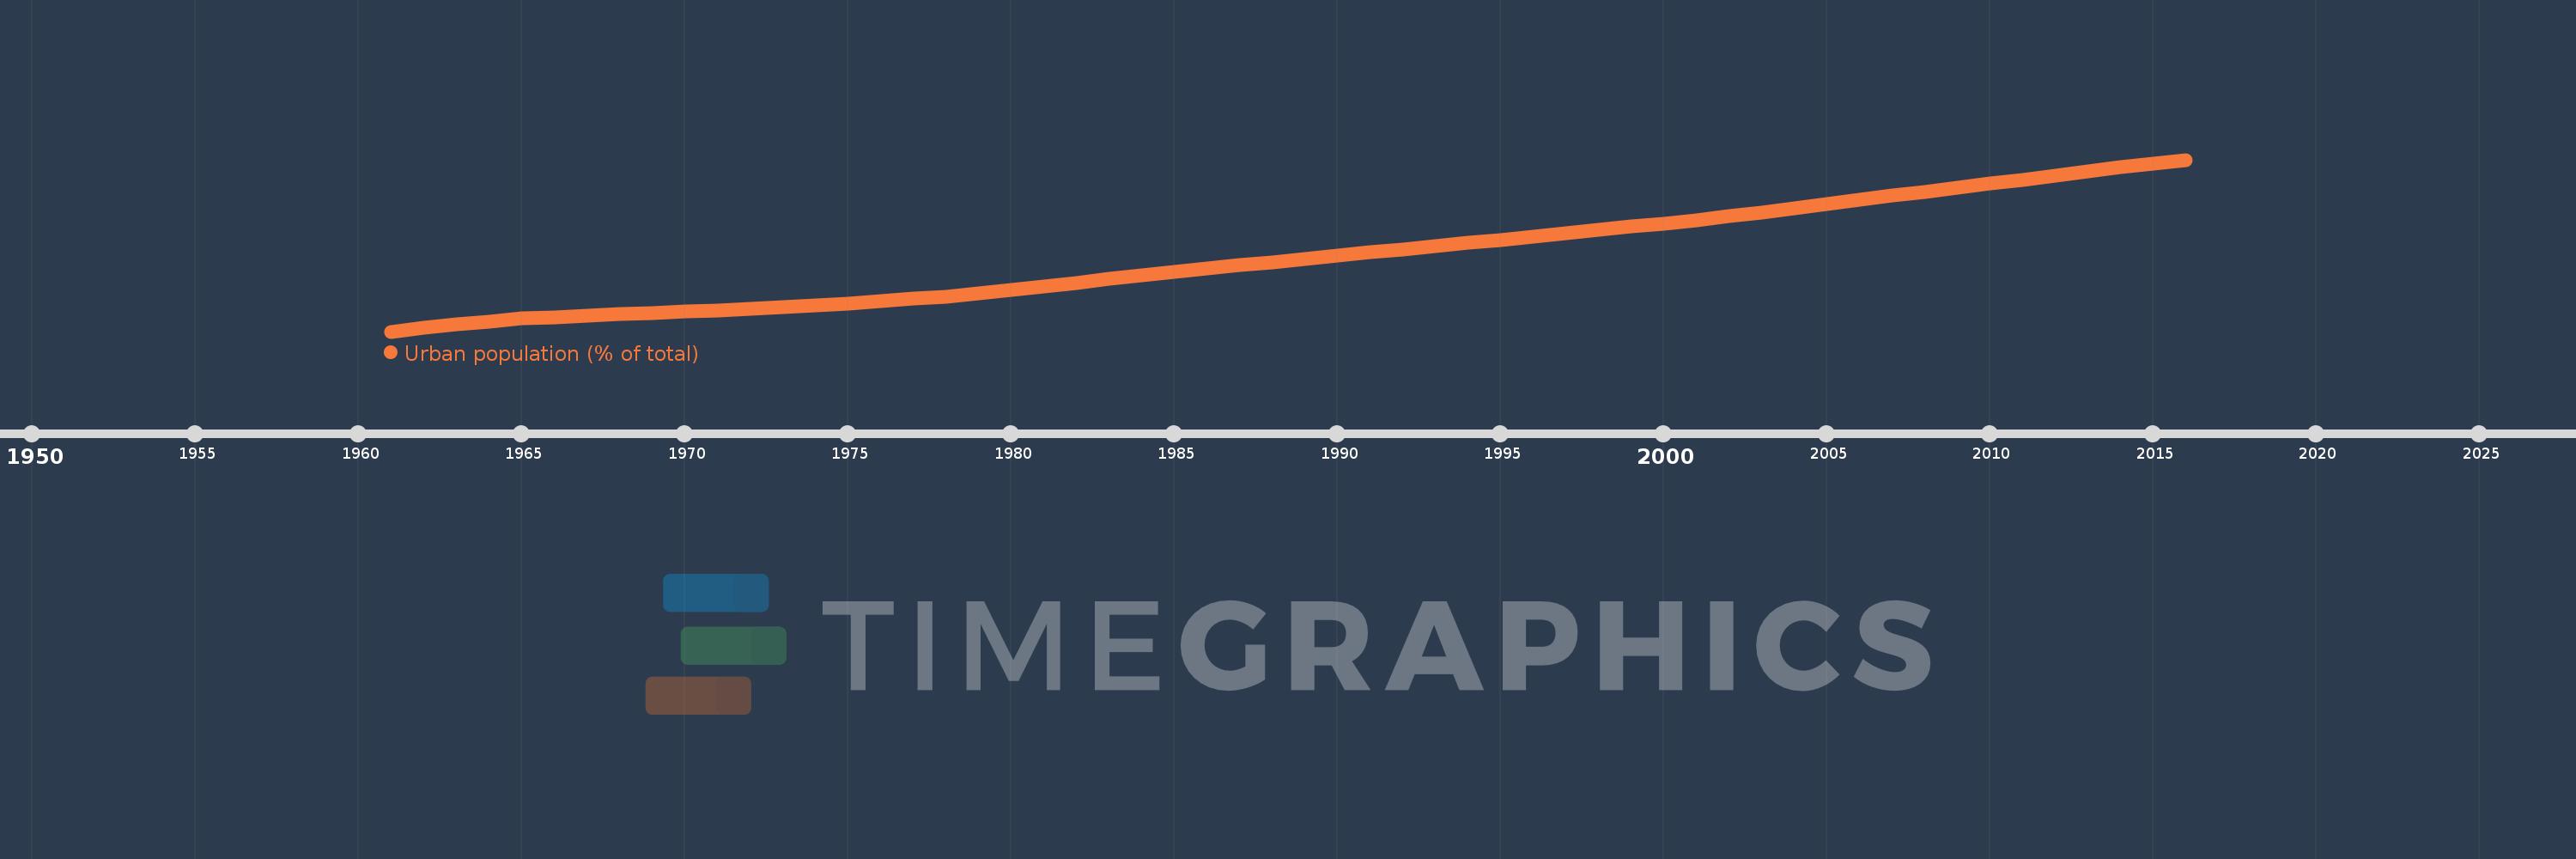
Urban population (% of total)
2016,2015,2014,2013,2012,2011,2010,2009,2008,2007,2006,2005,2004,2003,2002,2001,2000,1999,1998,1997,1996,1995,1994,1993,1992,1991,1990,1989,1988,1987,1986,1985,1984,1983,1982,1981,1980,1979,1978,1977,1976,1975,1974,1973,1972,1971,1970,1969,1968,1967,1966,1965,1964,1963,1962,1961
Estas estatísticas em outros países:
AfghanistanAlbaniaAlgeriaAmerican SamoaAndorraAngolaAntigua and BarbudaArab WorldArgentinaArmeniaArubaAustraliaAustriaAzerbaijanBahamas, TheBahrainBangladeshBarbadosBelarusBelgiumBelizeBeninBermudaBhutanBoliviaBosnia and HerzegovinaBotswanaBrazilBritish Virgin IslandsBrunei DarussalamBulgariaBurkina FasoBurundiCabo VerdeCambodiaCameroonCanadaCaribbean small statesCayman IslandsCentral African RepublicCentral Europe and the BalticsChadChannel IslandsChileChinaColombiaComorosCongo, Dem. Rep.Congo, Rep.Costa RicaCote d'IvoireCroatiaCubaCuracaoCyprusCzech RepublicDenmarkDjiboutiDominicaDominican RepublicEarly-demographic dividendEast Asia & PacificEast Asia & Pacific (excluding high income)East Asia & Pacific (IDA & IBRD countries)EcuadorEgypt, Arab Rep.El SalvadorEquatorial GuineaEritreaEstoniaEthiopiaEuro areaEurope & Central AsiaEurope & Central Asia (excluding high income)Europe & Central Asia (IDA & IBRD countries)European UnionFaroe IslandsFijiFinlandFragile and conflict affected situationsFranceFrench PolynesiaGabonGambia, TheGeorgiaGermanyGhanaGibraltarGreeceGreenlandGrenadaGuamGuatemalaGuineaGuinea-BissauGuyanaHaitiHeavily indebted poor countries (HIPC)High incomeHondurasHong Kong SAR, ChinaHungaryIBRD onlyIcelandIDA & IBRD totalIDA blendIDA onlyIDA totalIndiaIndonesiaIran, Islamic Rep.IraqIrelandIsle of ManIsraelItalyJamaicaJapanJordanKazakhstanKenyaKiribatiKorea, Dem. People’s Rep.Korea, Rep.KuwaitKyrgyz RepublicLao PDRLate-demographic dividendLatin America & Caribbean Latin America & Caribbean (excluding high income)Latin America & the Caribbean (IDA & IBRD countries)LatviaLeast developed countries: UN classificationLebanonLesothoLiberiaLibyaLiechtensteinLithuaniaLow & middle incomeLow incomeLower middle incomeLuxembourgMacao SAR, ChinaMacedonia, FYRMadagascarMalawiMalaysiaMaldivesMaliMaltaMarshall IslandsMauritaniaMauritiusMexicoMicronesia, Fed. Sts.Middle East & North AfricaMiddle East & North Africa (excluding high income)Middle East & North Africa (IDA & IBRD countries)Middle incomeMoldovaMonacoMongoliaMontenegroMoroccoMozambiqueMyanmarNamibiaNauruNepalNetherlandsNew CaledoniaNew ZealandNicaraguaNigerNigeriaNorth AmericaNorthern Mariana IslandsNorwayOECD membersOmanOther small statesPacific island small statesPakistanPalauPanamaPapua New GuineaParaguayPeruPhilippinesPolandPortugalPost-demographic dividendPre-demographic dividendPuerto RicoQatarRomaniaRussian FederationRwandaSamoaSan MarinoSao Tome and PrincipeSaudi ArabiaSenegalSerbiaSeychellesSierra LeoneSingaporeSint Maarten (Dutch part)Slovak RepublicSloveniaSmall statesSolomon IslandsSomaliaSouth AfricaSouth AsiaSouth Asia (IDA & IBRD)South SudanSpainSri LankaSt. Kitts and NevisSt. LuciaSt. Vincent and the GrenadinesSub-Saharan Africa Sub-Saharan Africa (excluding high income)Sub-Saharan Africa (IDA & IBRD countries)SudanSurinameSwazilandSwedenSwitzerlandSyrian Arab RepublicTajikistanTanzaniaThailandTimor-LesteTogoTongaTrinidad and TobagoTunisiaTurkeyTurkmenistanTurks and Caicos IslandsTuvaluUgandaUkraineUnited Arab EmiratesUnited KingdomUnited StatesUpper middle incomeUruguayUzbekistanVanuatuVenezuela, RBVietnamVirgin Islands (U.S.)West Bank and GazaWorldYemen, Rep.ZambiaZimbabwe Linha do tempo:
Nesta escala de tempo está apresentado um gráfico de 1961 ano até 2016 ano IBRD only. Dados de 1960 ano ausente. O número de observações reais por data: 56.
Fonte (nome):
Indicadores de desenvolvimento mundial
Fonte (organização):
United Nations, World Urbanization Prospects.
Categorias:
Climate Change, Urban Development
Foi atualizado:
23 abr 2017 ano
Indicadores de alterações dos valores ao longo dos anos
Mínimo:
26.225
1 jan 1961 ano
Máximo:
53.601
1 jan 2016 ano
Na data de observação
Valor
Mudança absoluta
A alteração em relação ao valor anterior
1 jan 1961 ano
26.225
+26.225
0.0%
1 jan 1962 ano
26.808
+0.583
2.22%
1 jan 1963 ano
27.344
+0.536
2.0%
1 jan 1964 ano
27.827
+0.483
1.77%
1 jan 1965 ano
28.319
+0.492
1.77%
1 jan 1966 ano
28.54
+0.221
0.78%
1 jan 1967 ano
28.745
+0.205
0.72%
1 jan 1968 ano
28.964
+0.219
0.76%
1 jan 1969 ano
29.18
+0.215
0.74%
1 jan 1970 ano
29.385
+0.205
0.7%
1 jan 1971 ano
29.583
+0.198
0.68%
1 jan 1972 ano
29.799
+0.216
0.73%
1 jan 1973 ano
30.059
+0.26
0.87%
1 jan 1974 ano
30.362
+0.303
1.01%
1 jan 1975 ano
30.712
+0.35
1.15%
1 jan 1976 ano
31.075
+0.362
1.18%
1 jan 1977 ano
31.428
+0.353
1.14%
1 jan 1978 ano
31.787
+0.359
1.14%
1 jan 1979 ano
32.259
+0.473
1.49%
1 jan 1980 ano
32.841
+0.581
1.8%
1 jan 1981 ano
33.427
+0.586
1.78%
1 jan 1982 ano
34.027
+0.601
1.8%
1 jan 1983 ano
34.608
+0.581
1.71%
1 jan 1984 ano
35.139
+0.531
1.53%
1 jan 1985 ano
35.685
+0.546
1.55%
1 jan 1986 ano
36.23
+0.545
1.53%
1 jan 1987 ano
36.769
+0.539
1.49%
1 jan 1988 ano
37.3
+0.53
1.44%
1 jan 1989 ano
37.827
+0.528
1.41%
1 jan 1990 ano
38.339
+0.512
1.35%
1 jan 1991 ano
38.829
+0.489
1.28%
1 jan 1992 ano
39.331
+0.502
1.29%
1 jan 1993 ano
39.834
+0.504
1.28%
1 jan 1994 ano
40.342
+0.508
1.27%
1 jan 1995 ano
40.853
+0.511
1.27%
1 jan 1996 ano
41.366
+0.513
1.26%
1 jan 1997 ano
41.88
+0.515
1.24%
1 jan 1998 ano
42.402
+0.522
1.25%
1 jan 1999 ano
42.932
+0.53
1.25%
1 jan 2000 ano
43.468
+0.535
1.25%
1 jan 2001 ano
44.009
+0.541
1.24%
1 jan 2002 ano
44.596
+0.588
1.34%
1 jan 2003 ano
45.239
+0.643
1.44%
1 jan 2004 ano
45.891
+0.652
1.44%
1 jan 2005 ano
46.549
+0.658
1.43%
1 jan 2006 ano
47.21
+0.661
1.42%
1 jan 2007 ano
47.861
+0.651
1.38%
1 jan 2008 ano
48.506
+0.644
1.35%
1 jan 2009 ano
49.153
+0.647
1.33%
1 jan 2010 ano
49.801
+0.648
1.32%
1 jan 2011 ano
50.451
+0.65
1.3%
1 jan 2012 ano
51.101
+0.65
1.29%
1 jan 2013 ano
51.744
+0.643
1.26%
1 jan 2014 ano
52.377
+0.632
1.22%
1 jan 2015 ano
52.996
+0.619
1.18%
1 jan 2016 ano
53.601
+0.605
1.14%
Classificação de países por estatísticas atuais por anos


Comentários: