29
/pt/
pt
AIzaSyAYiBZKx7MnpbEhh9jyipgxe19OcubqV5w
April 1, 2024
141265
Ghana
GHA
true
2
1
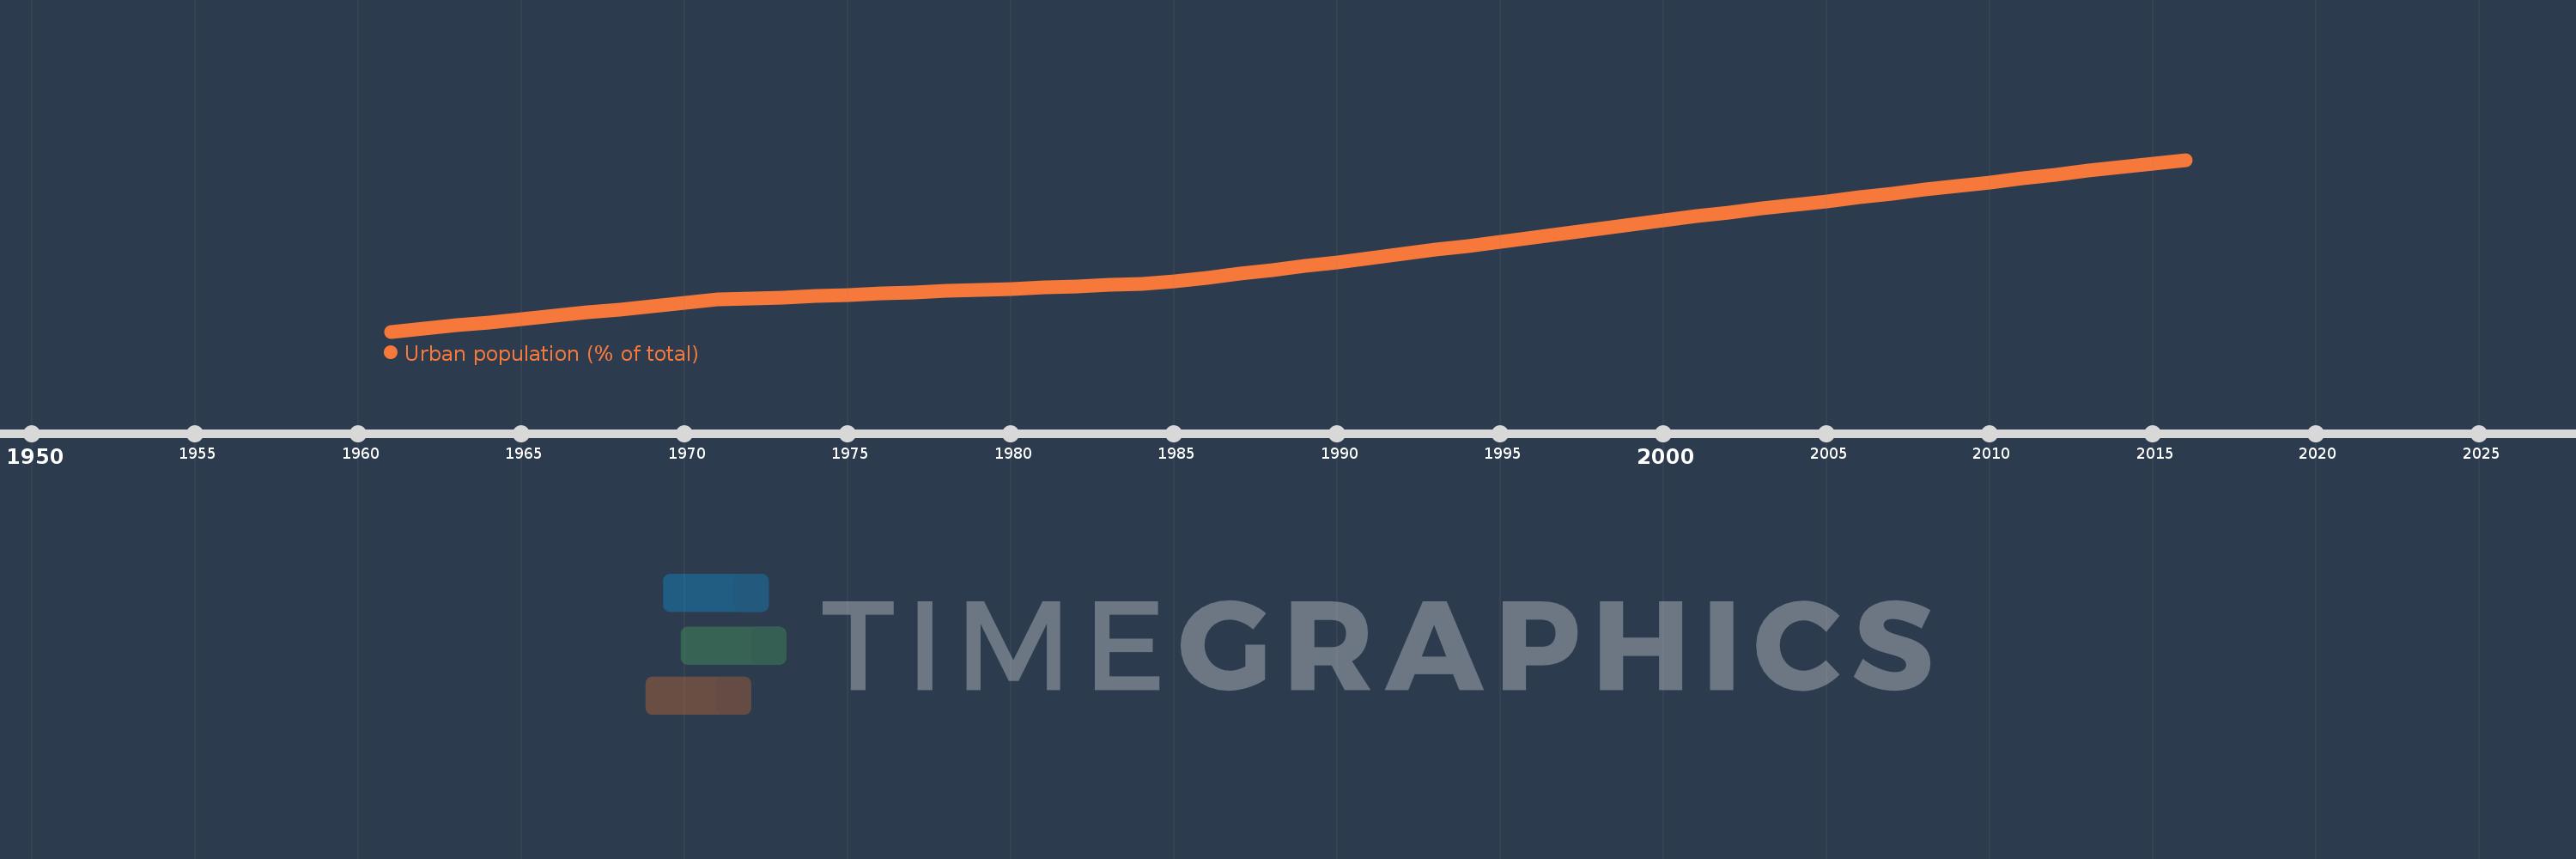
Urban population (% of total)
2016,2015,2014,2013,2012,2011,2010,2009,2008,2007,2006,2005,2004,2003,2002,2001,2000,1999,1998,1997,1996,1995,1994,1993,1992,1991,1990,1989,1988,1987,1986,1985,1984,1983,1982,1981,1980,1979,1978,1977,1976,1975,1974,1973,1972,1971,1970,1969,1968,1967,1966,1965,1964,1963,1962,1961
Estas estatísticas em outros países:
AfghanistanAlbaniaAlgeriaAmerican SamoaAndorraAngolaAntigua and BarbudaArab WorldArgentinaArmeniaArubaAustraliaAustriaAzerbaijanBahamas, TheBahrainBangladeshBarbadosBelarusBelgiumBelizeBeninBermudaBhutanBoliviaBosnia and HerzegovinaBotswanaBrazilBritish Virgin IslandsBrunei DarussalamBulgariaBurkina FasoBurundiCabo VerdeCambodiaCameroonCanadaCaribbean small statesCayman IslandsCentral African RepublicCentral Europe and the BalticsChadChannel IslandsChileChinaColombiaComorosCongo, Dem. Rep.Congo, Rep.Costa RicaCote d'IvoireCroatiaCubaCuracaoCyprusCzech RepublicDenmarkDjiboutiDominicaDominican RepublicEarly-demographic dividendEast Asia & PacificEast Asia & Pacific (excluding high income)East Asia & Pacific (IDA & IBRD countries)EcuadorEgypt, Arab Rep.El SalvadorEquatorial GuineaEritreaEstoniaEthiopiaEuro areaEurope & Central AsiaEurope & Central Asia (excluding high income)Europe & Central Asia (IDA & IBRD countries)European UnionFaroe IslandsFijiFinlandFragile and conflict affected situationsFranceFrench PolynesiaGabonGambia, TheGeorgiaGermanyGhanaGibraltarGreeceGreenlandGrenadaGuamGuatemalaGuineaGuinea-BissauGuyanaHaitiHeavily indebted poor countries (HIPC)High incomeHondurasHong Kong SAR, ChinaHungaryIBRD onlyIcelandIDA & IBRD totalIDA blendIDA onlyIDA totalIndiaIndonesiaIran, Islamic Rep.IraqIrelandIsle of ManIsraelItalyJamaicaJapanJordanKazakhstanKenyaKiribatiKorea, Dem. People’s Rep.Korea, Rep.KuwaitKyrgyz RepublicLao PDRLate-demographic dividendLatin America & Caribbean Latin America & Caribbean (excluding high income)Latin America & the Caribbean (IDA & IBRD countries)LatviaLeast developed countries: UN classificationLebanonLesothoLiberiaLibyaLiechtensteinLithuaniaLow & middle incomeLow incomeLower middle incomeLuxembourgMacao SAR, ChinaMacedonia, FYRMadagascarMalawiMalaysiaMaldivesMaliMaltaMarshall IslandsMauritaniaMauritiusMexicoMicronesia, Fed. Sts.Middle East & North AfricaMiddle East & North Africa (excluding high income)Middle East & North Africa (IDA & IBRD countries)Middle incomeMoldovaMonacoMongoliaMontenegroMoroccoMozambiqueMyanmarNamibiaNauruNepalNetherlandsNew CaledoniaNew ZealandNicaraguaNigerNigeriaNorth AmericaNorthern Mariana IslandsNorwayOECD membersOmanOther small statesPacific island small statesPakistanPalauPanamaPapua New GuineaParaguayPeruPhilippinesPolandPortugalPost-demographic dividendPre-demographic dividendPuerto RicoQatarRomaniaRussian FederationRwandaSamoaSan MarinoSao Tome and PrincipeSaudi ArabiaSenegalSerbiaSeychellesSierra LeoneSingaporeSint Maarten (Dutch part)Slovak RepublicSloveniaSmall statesSolomon IslandsSomaliaSouth AfricaSouth AsiaSouth Asia (IDA & IBRD)South SudanSpainSri LankaSt. Kitts and NevisSt. LuciaSt. Vincent and the GrenadinesSub-Saharan Africa Sub-Saharan Africa (excluding high income)Sub-Saharan Africa (IDA & IBRD countries)SudanSurinameSwazilandSwedenSwitzerlandSyrian Arab RepublicTajikistanTanzaniaThailandTimor-LesteTogoTongaTrinidad and TobagoTunisiaTurkeyTurkmenistanTurks and Caicos IslandsTuvaluUgandaUkraineUnited Arab EmiratesUnited KingdomUnited StatesUpper middle incomeUruguayUzbekistanVanuatuVenezuela, RBVietnamVirgin Islands (U.S.)West Bank and GazaWorldYemen, Rep.ZambiaZimbabwe Linha do tempo:
Nesta escala de tempo está apresentado um gráfico de 1961 ano até 2016 ano Ghana. Dados de 1960 ano ausente. O número de observações reais por data: 56.
Fonte (nome):
Indicadores de desenvolvimento mundial
Fonte (organização):
United Nations, World Urbanization Prospects.
Categorias:
Climate Change, Urban Development
Foi atualizado:
23 abr 2017 ano
Indicadores de alterações dos valores ao longo dos anos
Mínimo:
23.252
1 jan 1961 ano
Máximo:
54.042
1 jan 2016 ano
Na data de observação
Valor
Mudança absoluta
A alteração em relação ao valor anterior
1 jan 1961 ano
23.252
+23.252
0.0%
1 jan 1962 ano
23.797
+0.545
2.34%
1 jan 1963 ano
24.352
+0.555
2.33%
1 jan 1964 ano
24.915
+0.563
2.31%
1 jan 1965 ano
25.488
+0.573
2.3%
1 jan 1966 ano
26.067
+0.579
2.27%
1 jan 1967 ano
26.656
+0.589
2.26%
1 jan 1968 ano
27.254
+0.598
2.24%
1 jan 1969 ano
27.86
+0.606
2.22%
1 jan 1970 ano
28.473
+0.613
2.2%
1 jan 1971 ano
28.958
+0.485
1.7%
1 jan 1972 ano
29.174
+0.216
0.75%
1 jan 1973 ano
29.392
+0.218
0.75%
1 jan 1974 ano
29.61
+0.218
0.74%
1 jan 1975 ano
29.829
+0.219
0.74%
1 jan 1976 ano
30.049
+0.22
0.74%
1 jan 1977 ano
30.27
+0.221
0.74%
1 jan 1978 ano
30.492
+0.222
0.73%
1 jan 1979 ano
30.714
+0.222
0.73%
1 jan 1980 ano
30.938
+0.224
0.73%
1 jan 1981 ano
31.163
+0.225
0.73%
1 jan 1982 ano
31.388
+0.225
0.72%
1 jan 1983 ano
31.614
+0.226
0.72%
1 jan 1984 ano
31.842
+0.228
0.72%
1 jan 1985 ano
32.209
+0.367
1.15%
1 jan 1986 ano
32.896
+0.687
2.13%
1 jan 1987 ano
33.591
+0.695
2.11%
1 jan 1988 ano
34.293
+0.702
2.09%
1 jan 1989 ano
35.004
+0.711
2.07%
1 jan 1990 ano
35.719
+0.715
2.04%
1 jan 1991 ano
36.441
+0.722
2.02%
1 jan 1992 ano
37.17
+0.729
2.0%
1 jan 1993 ano
37.905
+0.735
1.98%
1 jan 1994 ano
38.644
+0.739
1.95%
1 jan 1995 ano
39.39
+0.746
1.93%
1 jan 1996 ano
40.14
+0.75
1.9%
1 jan 1997 ano
40.896
+0.756
1.88%
1 jan 1998 ano
41.654
+0.758
1.85%
1 jan 1999 ano
42.418
+0.764
1.83%
1 jan 2000 ano
43.184
+0.766
1.81%
1 jan 2001 ano
43.929
+0.745
1.73%
1 jan 2002 ano
44.601
+0.672
1.53%
1 jan 2003 ano
45.275
+0.674
1.51%
1 jan 2004 ano
45.951
+0.676
1.49%
1 jan 2005 ano
46.63
+0.679
1.48%
1 jan 2006 ano
47.308
+0.678
1.45%
1 jan 2007 ano
47.988
+0.68
1.44%
1 jan 2008 ano
48.669
+0.681
1.42%
1 jan 2009 ano
49.351
+0.682
1.4%
1 jan 2010 ano
50.031
+0.68
1.38%
1 jan 2011 ano
50.713
+0.682
1.36%
1 jan 2012 ano
51.394
+0.681
1.34%
1 jan 2013 ano
52.069
+0.675
1.31%
1 jan 2014 ano
52.735
+0.666
1.28%
1 jan 2015 ano
53.392
+0.657
1.25%
1 jan 2016 ano
54.042
+0.65
1.22%
Classificação de países por estatísticas atuais por anos


Comentários: