29
/pt/
pt
AIzaSyAYiBZKx7MnpbEhh9jyipgxe19OcubqV5w
April 1, 2024
117548
Cyprus
CYP
true
2
1
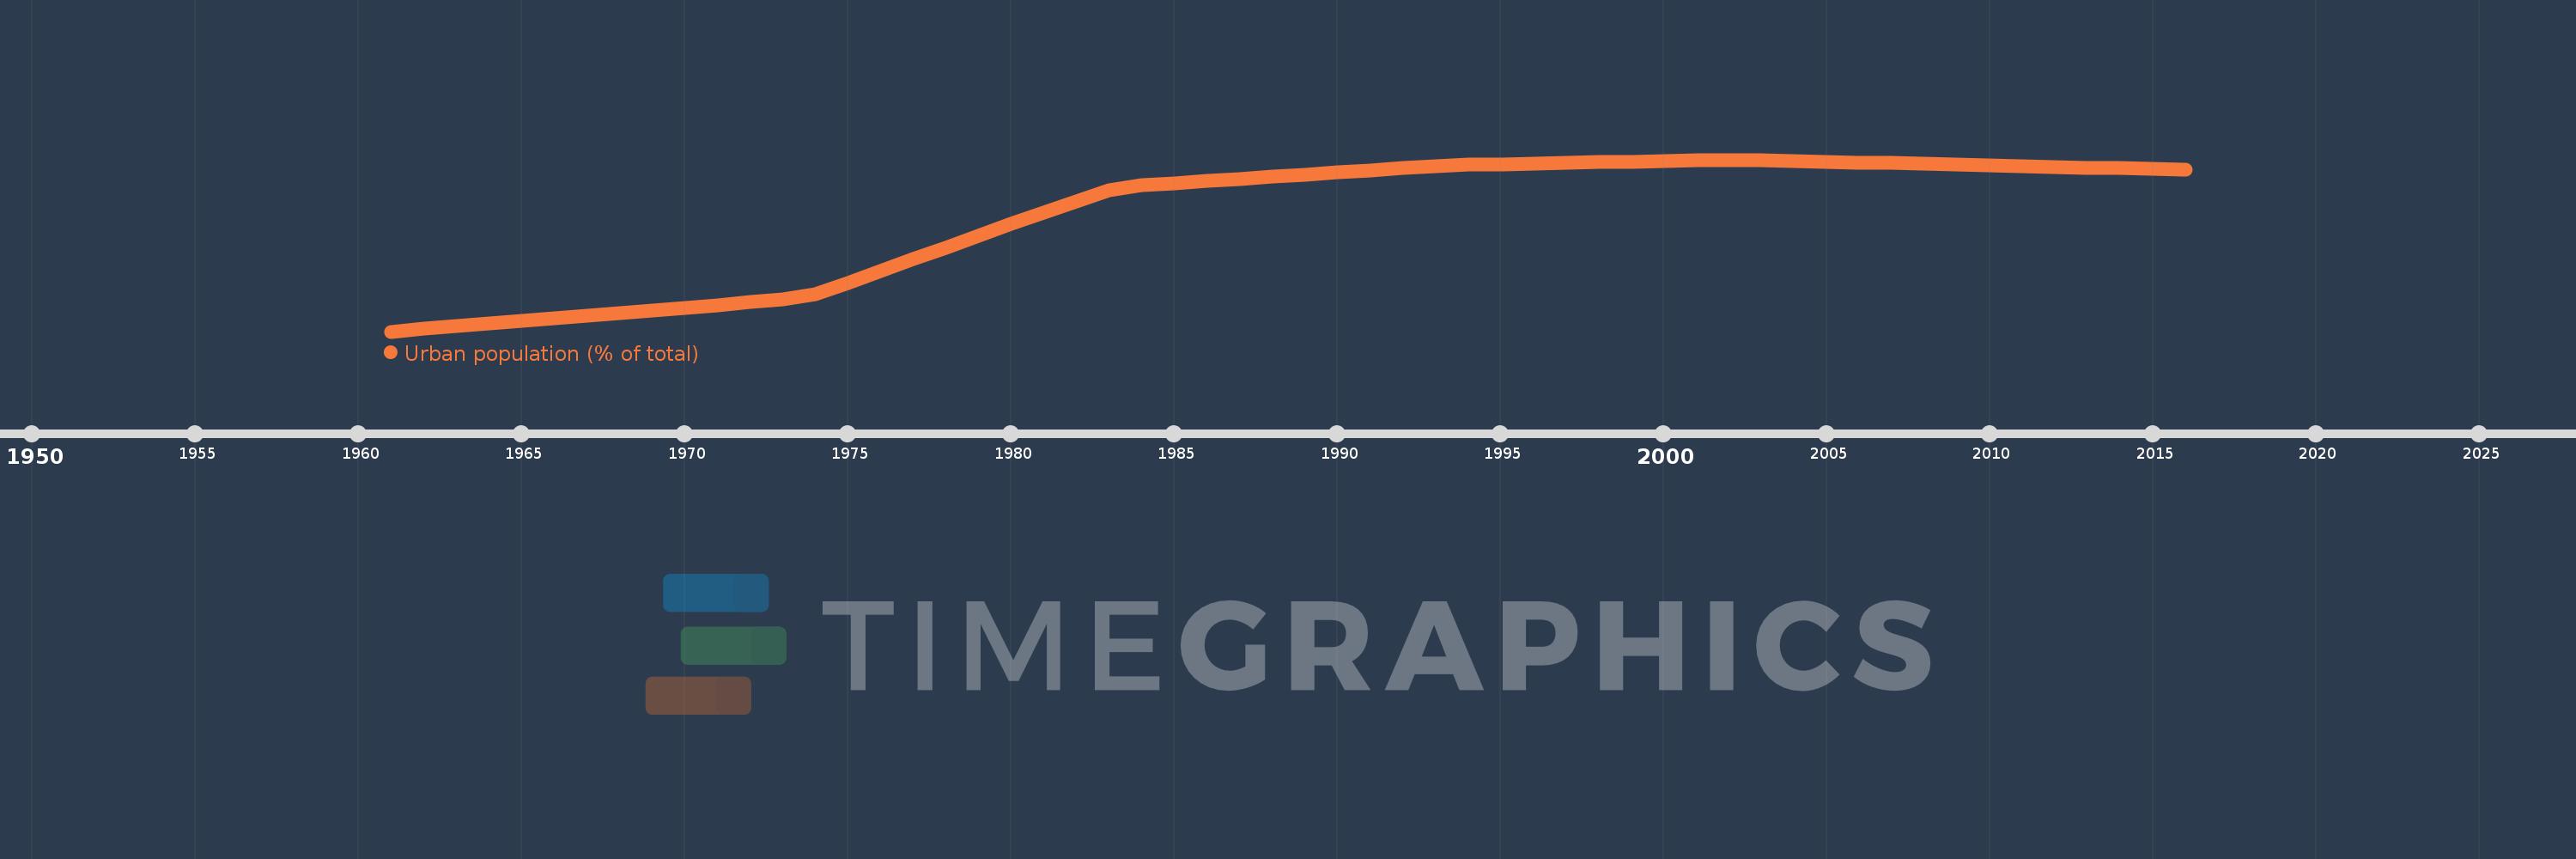
Urban population (% of total)
2016,2015,2014,2013,2012,2011,2010,2009,2008,2007,2006,2005,2004,2003,2002,2001,2000,1999,1998,1997,1996,1995,1994,1993,1992,1991,1990,1989,1988,1987,1986,1985,1984,1983,1982,1981,1980,1979,1978,1977,1976,1975,1974,1973,1972,1971,1970,1969,1968,1967,1966,1965,1964,1963,1962,1961
Estas estatísticas em outros países:
AfghanistanAlbaniaAlgeriaAmerican SamoaAndorraAngolaAntigua and BarbudaArab WorldArgentinaArmeniaArubaAustraliaAustriaAzerbaijanBahamas, TheBahrainBangladeshBarbadosBelarusBelgiumBelizeBeninBermudaBhutanBoliviaBosnia and HerzegovinaBotswanaBrazilBritish Virgin IslandsBrunei DarussalamBulgariaBurkina FasoBurundiCabo VerdeCambodiaCameroonCanadaCaribbean small statesCayman IslandsCentral African RepublicCentral Europe and the BalticsChadChannel IslandsChileChinaColombiaComorosCongo, Dem. Rep.Congo, Rep.Costa RicaCote d'IvoireCroatiaCubaCuracaoCyprusCzech RepublicDenmarkDjiboutiDominicaDominican RepublicEarly-demographic dividendEast Asia & PacificEast Asia & Pacific (excluding high income)East Asia & Pacific (IDA & IBRD countries)EcuadorEgypt, Arab Rep.El SalvadorEquatorial GuineaEritreaEstoniaEthiopiaEuro areaEurope & Central AsiaEurope & Central Asia (excluding high income)Europe & Central Asia (IDA & IBRD countries)European UnionFaroe IslandsFijiFinlandFragile and conflict affected situationsFranceFrench PolynesiaGabonGambia, TheGeorgiaGermanyGhanaGibraltarGreeceGreenlandGrenadaGuamGuatemalaGuineaGuinea-BissauGuyanaHaitiHeavily indebted poor countries (HIPC)High incomeHondurasHong Kong SAR, ChinaHungaryIBRD onlyIcelandIDA & IBRD totalIDA blendIDA onlyIDA totalIndiaIndonesiaIran, Islamic Rep.IraqIrelandIsle of ManIsraelItalyJamaicaJapanJordanKazakhstanKenyaKiribatiKorea, Dem. People’s Rep.Korea, Rep.KuwaitKyrgyz RepublicLao PDRLate-demographic dividendLatin America & Caribbean Latin America & Caribbean (excluding high income)Latin America & the Caribbean (IDA & IBRD countries)LatviaLeast developed countries: UN classificationLebanonLesothoLiberiaLibyaLiechtensteinLithuaniaLow & middle incomeLow incomeLower middle incomeLuxembourgMacao SAR, ChinaMacedonia, FYRMadagascarMalawiMalaysiaMaldivesMaliMaltaMarshall IslandsMauritaniaMauritiusMexicoMicronesia, Fed. Sts.Middle East & North AfricaMiddle East & North Africa (excluding high income)Middle East & North Africa (IDA & IBRD countries)Middle incomeMoldovaMonacoMongoliaMontenegroMoroccoMozambiqueMyanmarNamibiaNauruNepalNetherlandsNew CaledoniaNew ZealandNicaraguaNigerNigeriaNorth AmericaNorthern Mariana IslandsNorwayOECD membersOmanOther small statesPacific island small statesPakistanPalauPanamaPapua New GuineaParaguayPeruPhilippinesPolandPortugalPost-demographic dividendPre-demographic dividendPuerto RicoQatarRomaniaRussian FederationRwandaSamoaSan MarinoSao Tome and PrincipeSaudi ArabiaSenegalSerbiaSeychellesSierra LeoneSingaporeSint Maarten (Dutch part)Slovak RepublicSloveniaSmall statesSolomon IslandsSomaliaSouth AfricaSouth AsiaSouth Asia (IDA & IBRD)South SudanSpainSri LankaSt. Kitts and NevisSt. LuciaSt. Vincent and the GrenadinesSub-Saharan Africa Sub-Saharan Africa (excluding high income)Sub-Saharan Africa (IDA & IBRD countries)SudanSurinameSwazilandSwedenSwitzerlandSyrian Arab RepublicTajikistanTanzaniaThailandTimor-LesteTogoTongaTrinidad and TobagoTunisiaTurkeyTurkmenistanTurks and Caicos IslandsTuvaluUgandaUkraineUnited Arab EmiratesUnited KingdomUnited StatesUpper middle incomeUruguayUzbekistanVanuatuVenezuela, RBVietnamVirgin Islands (U.S.)West Bank and GazaWorldYemen, Rep.ZambiaZimbabwe Linha do tempo:
Nesta escala de tempo está apresentado um gráfico de 1961 ano até 2016 ano Cyprus. Dados de 1960 ano ausente. O número de observações reais por data: 56.
Fonte (nome):
Indicadores de desenvolvimento mundial
Fonte (organização):
United Nations, World Urbanization Prospects.
Categorias:
Climate Change, Urban Development
Foi atualizado:
23 abr 2017 ano
Indicadores de alterações dos valores ao longo dos anos
Mínimo:
35.628
1 jan 1961 ano
Máximo:
68.769
1 jan 2002 ano
Na data de observação
Valor
Mudança absoluta
A alteração em relação ao valor anterior
1 jan 1961 ano
35.628
+35.628
0.0%
1 jan 1962 ano
36.175
+0.547
1.54%
1 jan 1963 ano
36.674
+0.499
1.38%
1 jan 1964 ano
37.176
+0.502
1.37%
1 jan 1965 ano
37.681
+0.505
1.36%
1 jan 1966 ano
38.188
+0.507
1.35%
1 jan 1967 ano
38.698
+0.51
1.34%
1 jan 1968 ano
39.21
+0.512
1.32%
1 jan 1969 ano
39.726
+0.516
1.32%
1 jan 1970 ano
40.242
+0.516
1.3%
1 jan 1971 ano
40.761
+0.519
1.29%
1 jan 1972 ano
41.283
+0.522
1.28%
1 jan 1973 ano
41.807
+0.524
1.27%
1 jan 1974 ano
42.757
+0.95
2.27%
1 jan 1975 ano
45.007
+2.25
5.26%
1 jan 1976 ano
47.277
+2.27
5.04%
1 jan 1977 ano
49.563
+2.286
4.84%
1 jan 1978 ano
51.843
+2.28
4.6%
1 jan 1979 ano
54.119
+2.276
4.39%
1 jan 1980 ano
56.378
+2.259
4.17%
1 jan 1981 ano
58.614
+2.236
3.97%
1 jan 1982 ano
60.809
+2.195
3.74%
1 jan 1983 ano
62.964
+2.155
3.54%
1 jan 1984 ano
63.822
+0.858
1.36%
1 jan 1985 ano
64.252
+0.43
0.67%
1 jan 1986 ano
64.678
+0.426
0.66%
1 jan 1987 ano
65.102
+0.424
0.66%
1 jan 1988 ano
65.524
+0.422
0.65%
1 jan 1989 ano
65.945
+0.421
0.64%
1 jan 1990 ano
66.361
+0.416
0.63%
1 jan 1991 ano
66.776
+0.415
0.63%
1 jan 1992 ano
67.188
+0.412
0.62%
1 jan 1993 ano
67.598
+0.41
0.61%
1 jan 1994 ano
67.792
+0.194
0.29%
1 jan 1995 ano
67.915
+0.123
0.18%
1 jan 1996 ano
68.038
+0.123
0.18%
1 jan 1997 ano
68.161
+0.123
0.18%
1 jan 1998 ano
68.283
+0.122
0.18%
1 jan 1999 ano
68.405
+0.122
0.18%
1 jan 2000 ano
68.527
+0.122
0.18%
1 jan 2001 ano
68.648
+0.121
0.18%
1 jan 2002 ano
68.769
+0.121
0.18%
1 jan 2003 ano
68.694
-0.075
-0.11%
1 jan 2004 ano
68.553
-0.141
-0.21%
1 jan 2005 ano
68.41
-0.143
-0.21%
1 jan 2006 ano
68.268
-0.142
-0.21%
1 jan 2007 ano
68.125
-0.143
-0.21%
1 jan 2008 ano
67.982
-0.143
-0.21%
1 jan 2009 ano
67.839
-0.143
-0.21%
1 jan 2010 ano
67.695
-0.144
-0.21%
1 jan 2011 ano
67.551
-0.144
-0.21%
1 jan 2012 ano
67.406
-0.145
-0.21%
1 jan 2013 ano
67.261
-0.145
-0.22%
1 jan 2014 ano
67.133
-0.128
-0.19%
1 jan 2015 ano
67.019
-0.114
-0.17%
1 jan 2016 ano
66.921
-0.098
-0.15%
Classificação de países por estatísticas atuais por anos


Comentários: