29
/pt/
pt
AIzaSyAYiBZKx7MnpbEhh9jyipgxe19OcubqV5w
April 1, 2024
42027
Latin America & Caribbean
LCN
false
2
1
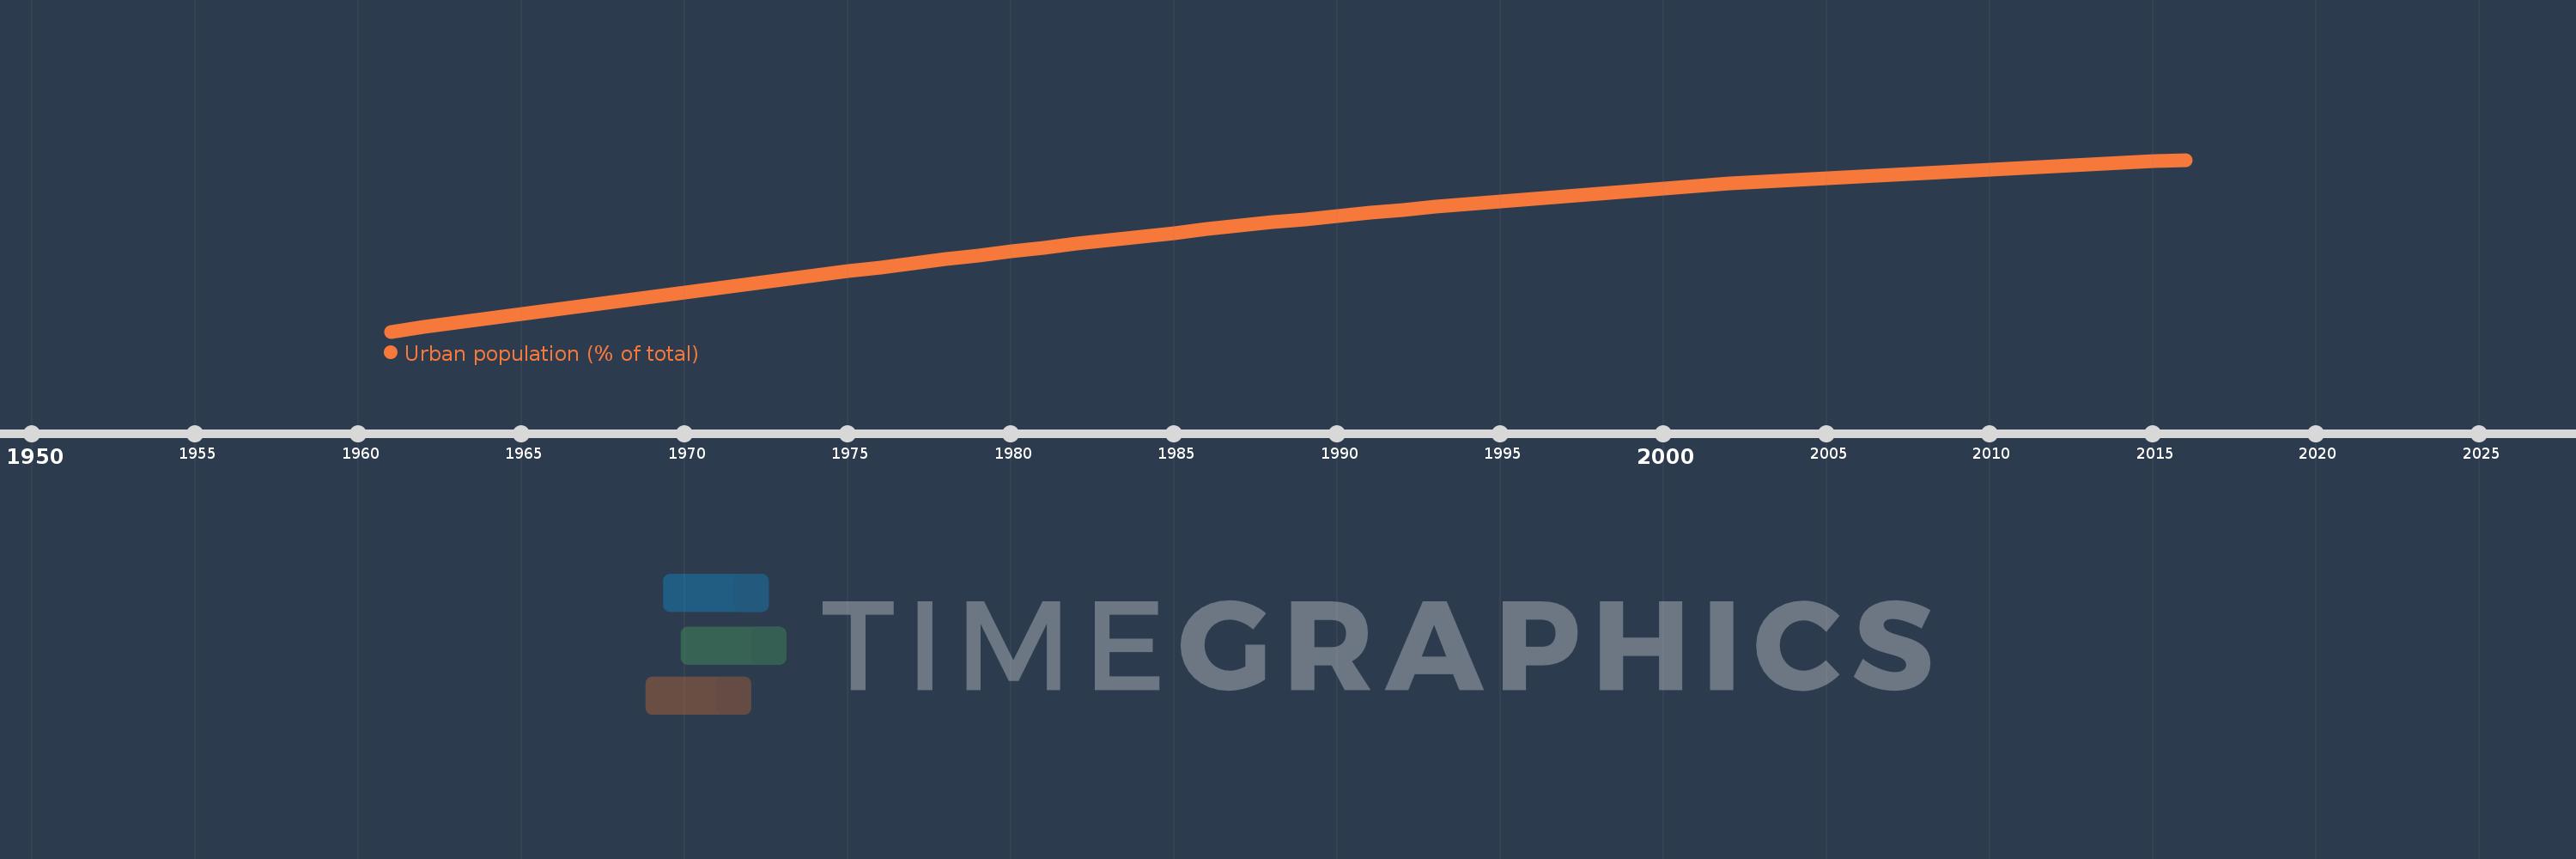
Urban population (% of total)
2016,2015,2014,2013,2012,2011,2010,2009,2008,2007,2006,2005,2004,2003,2002,2001,2000,1999,1998,1997,1996,1995,1994,1993,1992,1991,1990,1989,1988,1987,1986,1985,1984,1983,1982,1981,1980,1979,1978,1977,1976,1975,1974,1973,1972,1971,1970,1969,1968,1967,1966,1965,1964,1963,1962,1961
Estas estatísticas em outros países:
AfghanistanAlbaniaAlgeriaAmerican SamoaAndorraAngolaAntigua and BarbudaArab WorldArgentinaArmeniaArubaAustraliaAustriaAzerbaijanBahamas, TheBahrainBangladeshBarbadosBelarusBelgiumBelizeBeninBermudaBhutanBoliviaBosnia and HerzegovinaBotswanaBrazilBritish Virgin IslandsBrunei DarussalamBulgariaBurkina FasoBurundiCabo VerdeCambodiaCameroonCanadaCaribbean small statesCayman IslandsCentral African RepublicCentral Europe and the BalticsChadChannel IslandsChileChinaColombiaComorosCongo, Dem. Rep.Congo, Rep.Costa RicaCote d'IvoireCroatiaCubaCuracaoCyprusCzech RepublicDenmarkDjiboutiDominicaDominican RepublicEarly-demographic dividendEast Asia & PacificEast Asia & Pacific (excluding high income)East Asia & Pacific (IDA & IBRD countries)EcuadorEgypt, Arab Rep.El SalvadorEquatorial GuineaEritreaEstoniaEthiopiaEuro areaEurope & Central AsiaEurope & Central Asia (excluding high income)Europe & Central Asia (IDA & IBRD countries)European UnionFaroe IslandsFijiFinlandFragile and conflict affected situationsFranceFrench PolynesiaGabonGambia, TheGeorgiaGermanyGhanaGibraltarGreeceGreenlandGrenadaGuamGuatemalaGuineaGuinea-BissauGuyanaHaitiHeavily indebted poor countries (HIPC)High incomeHondurasHong Kong SAR, ChinaHungaryIBRD onlyIcelandIDA & IBRD totalIDA blendIDA onlyIDA totalIndiaIndonesiaIran, Islamic Rep.IraqIrelandIsle of ManIsraelItalyJamaicaJapanJordanKazakhstanKenyaKiribatiKorea, Dem. People’s Rep.Korea, Rep.KuwaitKyrgyz RepublicLao PDRLate-demographic dividendLatin America & Caribbean Latin America & Caribbean (excluding high income)Latin America & the Caribbean (IDA & IBRD countries)LatviaLeast developed countries: UN classificationLebanonLesothoLiberiaLibyaLiechtensteinLithuaniaLow & middle incomeLow incomeLower middle incomeLuxembourgMacao SAR, ChinaMacedonia, FYRMadagascarMalawiMalaysiaMaldivesMaliMaltaMarshall IslandsMauritaniaMauritiusMexicoMicronesia, Fed. Sts.Middle East & North AfricaMiddle East & North Africa (excluding high income)Middle East & North Africa (IDA & IBRD countries)Middle incomeMoldovaMonacoMongoliaMontenegroMoroccoMozambiqueMyanmarNamibiaNauruNepalNetherlandsNew CaledoniaNew ZealandNicaraguaNigerNigeriaNorth AmericaNorthern Mariana IslandsNorwayOECD membersOmanOther small statesPacific island small statesPakistanPalauPanamaPapua New GuineaParaguayPeruPhilippinesPolandPortugalPost-demographic dividendPre-demographic dividendPuerto RicoQatarRomaniaRussian FederationRwandaSamoaSan MarinoSao Tome and PrincipeSaudi ArabiaSenegalSerbiaSeychellesSierra LeoneSingaporeSint Maarten (Dutch part)Slovak RepublicSloveniaSmall statesSolomon IslandsSomaliaSouth AfricaSouth AsiaSouth Asia (IDA & IBRD)South SudanSpainSri LankaSt. Kitts and NevisSt. LuciaSt. Vincent and the GrenadinesSub-Saharan Africa Sub-Saharan Africa (excluding high income)Sub-Saharan Africa (IDA & IBRD countries)SudanSurinameSwazilandSwedenSwitzerlandSyrian Arab RepublicTajikistanTanzaniaThailandTimor-LesteTogoTongaTrinidad and TobagoTunisiaTurkeyTurkmenistanTurks and Caicos IslandsTuvaluUgandaUkraineUnited Arab EmiratesUnited KingdomUnited StatesUpper middle incomeUruguayUzbekistanVanuatuVenezuela, RBVietnamVirgin Islands (U.S.)West Bank and GazaWorldYemen, Rep.ZambiaZimbabwe Linha do tempo:
Nesta escala de tempo está apresentado um gráfico de 1961 ano até 2016 ano Latin America & Caribbean . Dados de 1960 ano ausente. O número de observações reais por data: 56.
Fonte (nome):
Indicadores de desenvolvimento mundial
Fonte (organização):
United Nations, World Urbanization Prospects.
Categorias:
Climate Change, Urban Development
Foi atualizado:
23 abr 2017 ano
Indicadores de alterações dos valores ao longo dos anos
Mínimo:
49.283
1 jan 1961 ano
Máximo:
79.881
1 jan 2016 ano
Na data de observação
Valor
Mudança absoluta
A alteração em relação ao valor anterior
1 jan 1961 ano
49.283
+49.283
0.0%
1 jan 1962 ano
50.072
+0.789
1.6%
1 jan 1963 ano
50.871
+0.799
1.6%
1 jan 1964 ano
51.673
+0.802
1.58%
1 jan 1965 ano
52.481
+0.808
1.56%
1 jan 1966 ano
53.242
+0.761
1.45%
1 jan 1967 ano
54.003
+0.762
1.43%
1 jan 1968 ano
54.764
+0.761
1.41%
1 jan 1969 ano
55.526
+0.762
1.39%
1 jan 1970 ano
56.284
+0.758
1.37%
1 jan 1971 ano
57.037
+0.753
1.34%
1 jan 1972 ano
57.797
+0.759
1.33%
1 jan 1973 ano
58.549
+0.752
1.3%
1 jan 1974 ano
59.277
+0.728
1.24%
1 jan 1975 ano
59.996
+0.719
1.21%
1 jan 1976 ano
60.714
+0.718
1.2%
1 jan 1977 ano
61.429
+0.714
1.18%
1 jan 1978 ano
62.142
+0.713
1.16%
1 jan 1979 ano
62.851
+0.71
1.14%
1 jan 1980 ano
63.554
+0.703
1.12%
1 jan 1981 ano
64.256
+0.702
1.1%
1 jan 1982 ano
64.942
+0.686
1.07%
1 jan 1983 ano
65.599
+0.657
1.01%
1 jan 1984 ano
66.238
+0.639
0.97%
1 jan 1985 ano
66.871
+0.633
0.96%
1 jan 1986 ano
67.498
+0.627
0.94%
1 jan 1987 ano
68.112
+0.613
0.91%
1 jan 1988 ano
68.714
+0.602
0.88%
1 jan 1989 ano
69.308
+0.594
0.87%
1 jan 1990 ano
69.89
+0.582
0.84%
1 jan 1991 ano
70.455
+0.566
0.81%
1 jan 1992 ano
70.987
+0.532
0.75%
1 jan 1993 ano
71.496
+0.509
0.72%
1 jan 1994 ano
71.993
+0.497
0.69%
1 jan 1995 ano
72.485
+0.492
0.68%
1 jan 1996 ano
72.969
+0.484
0.67%
1 jan 1997 ano
73.43
+0.461
0.63%
1 jan 1998 ano
73.901
+0.471
0.64%
1 jan 1999 ano
74.368
+0.467
0.63%
1 jan 2000 ano
74.819
+0.451
0.61%
1 jan 2001 ano
75.268
+0.449
0.6%
1 jan 2002 ano
75.627
+0.36
0.48%
1 jan 2003 ano
75.964
+0.337
0.45%
1 jan 2004 ano
76.294
+0.33
0.43%
1 jan 2005 ano
76.621
+0.327
0.43%
1 jan 2006 ano
76.942
+0.321
0.42%
1 jan 2007 ano
77.259
+0.316
0.41%
1 jan 2008 ano
77.57
+0.311
0.4%
1 jan 2009 ano
77.876
+0.307
0.4%
1 jan 2010 ano
78.178
+0.301
0.39%
1 jan 2011 ano
78.476
+0.298
0.38%
1 jan 2012 ano
78.77
+0.294
0.37%
1 jan 2013 ano
79.057
+0.287
0.36%
1 jan 2014 ano
79.338
+0.281
0.36%
1 jan 2015 ano
79.613
+0.275
0.35%
1 jan 2016 ano
79.881
+0.268
0.34%
Classificação de países por estatísticas atuais por anos


Comentários: