29
/pt/
pt
AIzaSyAYiBZKx7MnpbEhh9jyipgxe19OcubqV5w
April 1, 2024
174939
Lao PDR
LAO
true
2
1
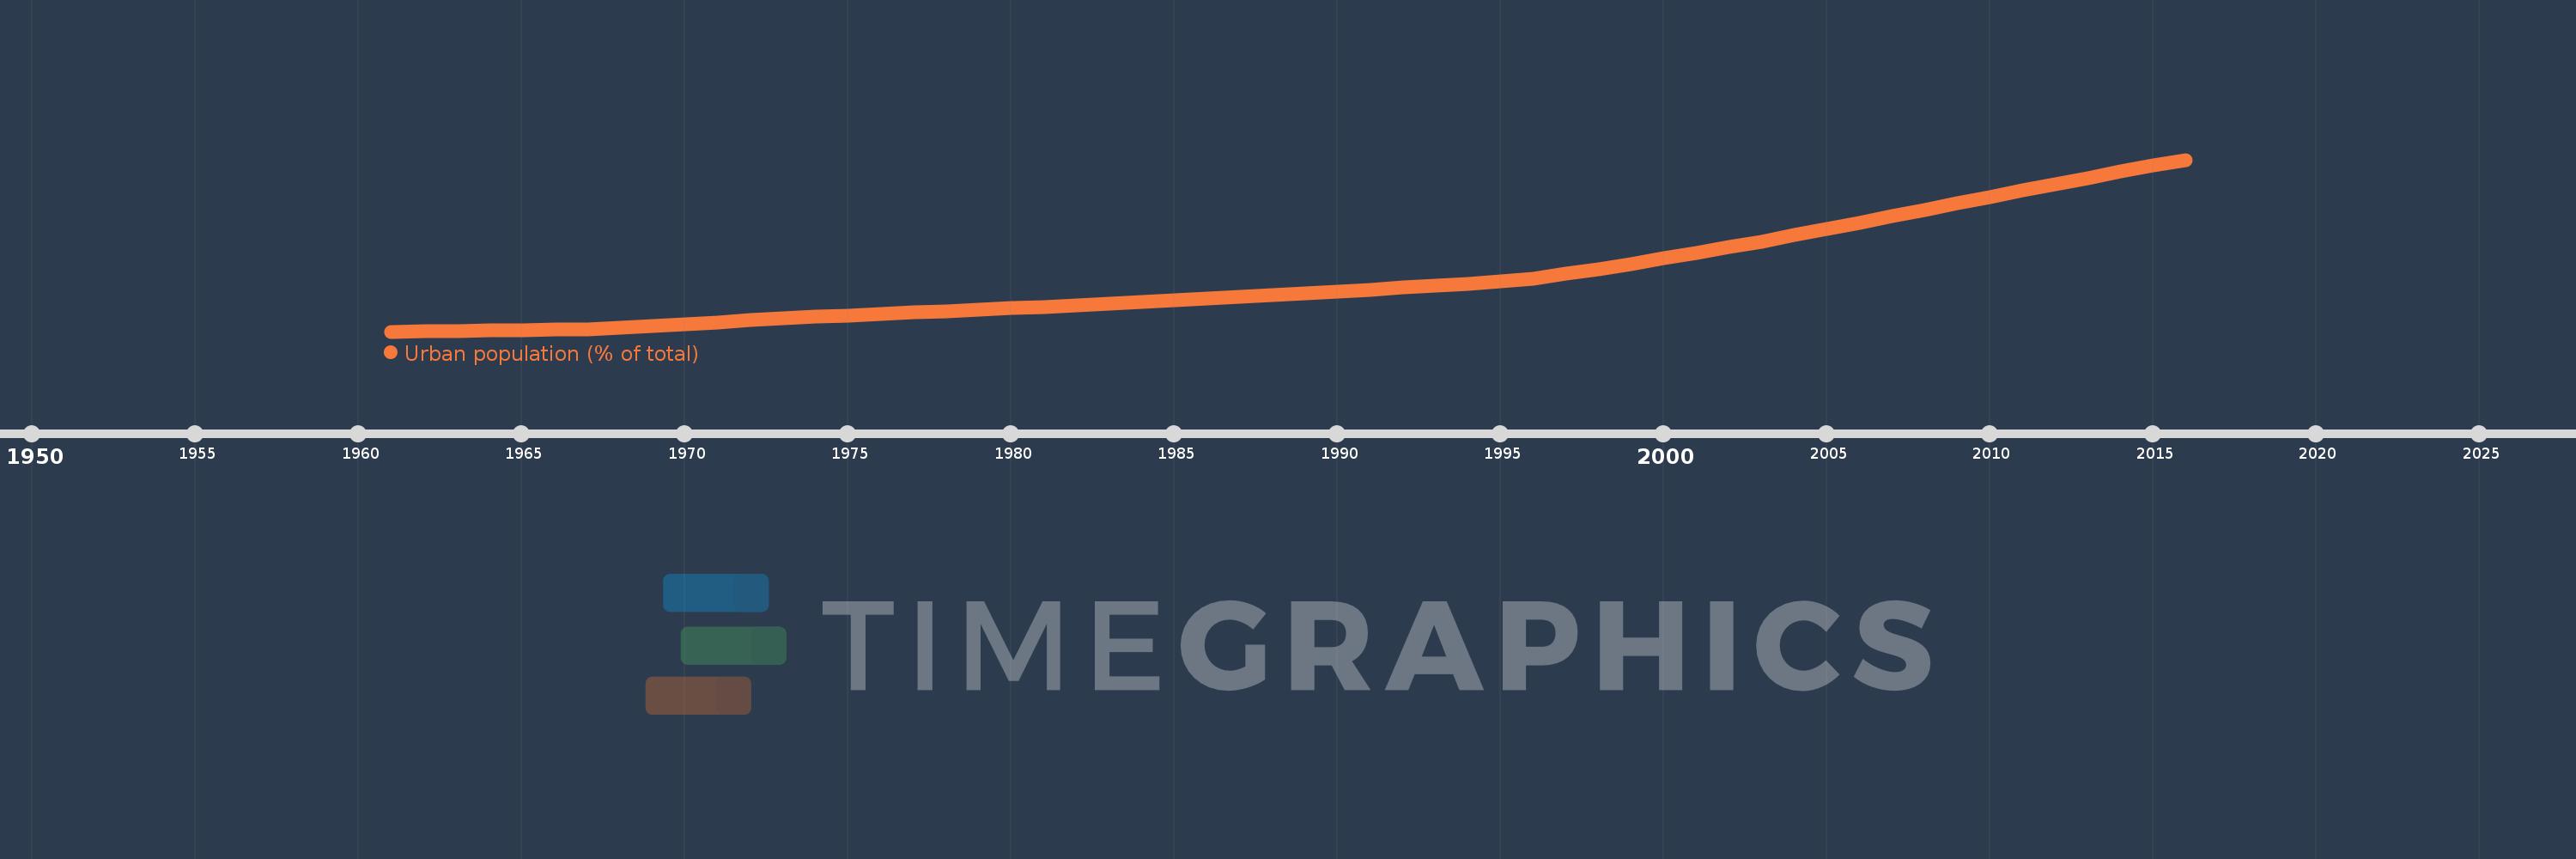
Urban population (% of total)
2016,2015,2014,2013,2012,2011,2010,2009,2008,2007,2006,2005,2004,2003,2002,2001,2000,1999,1998,1997,1996,1995,1994,1993,1992,1991,1990,1989,1988,1987,1986,1985,1984,1983,1982,1981,1980,1979,1978,1977,1976,1975,1974,1973,1972,1971,1970,1969,1968,1967,1966,1965,1964,1963,1962,1961
Estas estatísticas em outros países:
AfghanistanAlbaniaAlgeriaAmerican SamoaAndorraAngolaAntigua and BarbudaArab WorldArgentinaArmeniaArubaAustraliaAustriaAzerbaijanBahamas, TheBahrainBangladeshBarbadosBelarusBelgiumBelizeBeninBermudaBhutanBoliviaBosnia and HerzegovinaBotswanaBrazilBritish Virgin IslandsBrunei DarussalamBulgariaBurkina FasoBurundiCabo VerdeCambodiaCameroonCanadaCaribbean small statesCayman IslandsCentral African RepublicCentral Europe and the BalticsChadChannel IslandsChileChinaColombiaComorosCongo, Dem. Rep.Congo, Rep.Costa RicaCote d'IvoireCroatiaCubaCuracaoCyprusCzech RepublicDenmarkDjiboutiDominicaDominican RepublicEarly-demographic dividendEast Asia & PacificEast Asia & Pacific (excluding high income)East Asia & Pacific (IDA & IBRD countries)EcuadorEgypt, Arab Rep.El SalvadorEquatorial GuineaEritreaEstoniaEthiopiaEuro areaEurope & Central AsiaEurope & Central Asia (excluding high income)Europe & Central Asia (IDA & IBRD countries)European UnionFaroe IslandsFijiFinlandFragile and conflict affected situationsFranceFrench PolynesiaGabonGambia, TheGeorgiaGermanyGhanaGibraltarGreeceGreenlandGrenadaGuamGuatemalaGuineaGuinea-BissauGuyanaHaitiHeavily indebted poor countries (HIPC)High incomeHondurasHong Kong SAR, ChinaHungaryIBRD onlyIcelandIDA & IBRD totalIDA blendIDA onlyIDA totalIndiaIndonesiaIran, Islamic Rep.IraqIrelandIsle of ManIsraelItalyJamaicaJapanJordanKazakhstanKenyaKiribatiKorea, Dem. People’s Rep.Korea, Rep.KuwaitKyrgyz RepublicLao PDRLate-demographic dividendLatin America & Caribbean Latin America & Caribbean (excluding high income)Latin America & the Caribbean (IDA & IBRD countries)LatviaLeast developed countries: UN classificationLebanonLesothoLiberiaLibyaLiechtensteinLithuaniaLow & middle incomeLow incomeLower middle incomeLuxembourgMacao SAR, ChinaMacedonia, FYRMadagascarMalawiMalaysiaMaldivesMaliMaltaMarshall IslandsMauritaniaMauritiusMexicoMicronesia, Fed. Sts.Middle East & North AfricaMiddle East & North Africa (excluding high income)Middle East & North Africa (IDA & IBRD countries)Middle incomeMoldovaMonacoMongoliaMontenegroMoroccoMozambiqueMyanmarNamibiaNauruNepalNetherlandsNew CaledoniaNew ZealandNicaraguaNigerNigeriaNorth AmericaNorthern Mariana IslandsNorwayOECD membersOmanOther small statesPacific island small statesPakistanPalauPanamaPapua New GuineaParaguayPeruPhilippinesPolandPortugalPost-demographic dividendPre-demographic dividendPuerto RicoQatarRomaniaRussian FederationRwandaSamoaSan MarinoSao Tome and PrincipeSaudi ArabiaSenegalSerbiaSeychellesSierra LeoneSingaporeSint Maarten (Dutch part)Slovak RepublicSloveniaSmall statesSolomon IslandsSomaliaSouth AfricaSouth AsiaSouth Asia (IDA & IBRD)South SudanSpainSri LankaSt. Kitts and NevisSt. LuciaSt. Vincent and the GrenadinesSub-Saharan Africa Sub-Saharan Africa (excluding high income)Sub-Saharan Africa (IDA & IBRD countries)SudanSurinameSwazilandSwedenSwitzerlandSyrian Arab RepublicTajikistanTanzaniaThailandTimor-LesteTogoTongaTrinidad and TobagoTunisiaTurkeyTurkmenistanTurks and Caicos IslandsTuvaluUgandaUkraineUnited Arab EmiratesUnited KingdomUnited StatesUpper middle incomeUruguayUzbekistanVanuatuVenezuela, RBVietnamVirgin Islands (U.S.)West Bank and GazaWorldYemen, Rep.ZambiaZimbabwe Linha do tempo:
Nesta escala de tempo está apresentado um gráfico de 1961 ano até 2016 ano Lao PDR. Dados de 1960 ano ausente. O número de observações reais por data: 56.
Fonte (nome):
Indicadores de desenvolvimento mundial
Fonte (organização):
United Nations, World Urbanization Prospects.
Categorias:
Climate Change, Urban Development
Foi atualizado:
23 abr 2017 ano
Indicadores de alterações dos valores ao longo dos anos
Mínimo:
7.946
1 jan 1961 ano
Máximo:
38.614
1 jan 2016 ano
Na data de observação
Valor
Mudança absoluta
A alteração em relação ao valor anterior
1 jan 1961 ano
7.946
+7.946
0.0%
1 jan 1962 ano
8.02
+0.074
0.93%
1 jan 1963 ano
8.095
+0.075
0.94%
1 jan 1964 ano
8.17
+0.075
0.93%
1 jan 1965 ano
8.246
+0.076
0.93%
1 jan 1966 ano
8.323
+0.077
0.93%
1 jan 1967 ano
8.4
+0.077
0.93%
1 jan 1968 ano
8.692
+0.292
3.48%
1 jan 1969 ano
8.994
+0.302
3.47%
1 jan 1970 ano
9.304
+0.31
3.45%
1 jan 1971 ano
9.625
+0.321
3.45%
1 jan 1972 ano
9.955
+0.33
3.43%
1 jan 1973 ano
10.295
+0.34
3.42%
1 jan 1974 ano
10.597
+0.302
2.93%
1 jan 1975 ano
10.837
+0.24
2.26%
1 jan 1976 ano
11.081
+0.244
2.25%
1 jan 1977 ano
11.331
+0.25
2.26%
1 jan 1978 ano
11.584
+0.253
2.23%
1 jan 1979 ano
11.843
+0.259
2.24%
1 jan 1980 ano
12.107
+0.264
2.23%
1 jan 1981 ano
12.377
+0.27
2.23%
1 jan 1982 ano
12.65
+0.273
2.21%
1 jan 1983 ano
12.93
+0.28
2.21%
1 jan 1984 ano
13.214
+0.284
2.2%
1 jan 1985 ano
13.504
+0.29
2.19%
1 jan 1986 ano
13.804
+0.3
2.22%
1 jan 1987 ano
14.118
+0.314
2.27%
1 jan 1988 ano
14.439
+0.321
2.27%
1 jan 1989 ano
14.766
+0.327
2.26%
1 jan 1990 ano
15.098
+0.332
2.25%
1 jan 1991 ano
15.437
+0.339
2.25%
1 jan 1992 ano
15.782
+0.345
2.23%
1 jan 1993 ano
16.133
+0.351
2.22%
1 jan 1994 ano
16.49
+0.357
2.21%
1 jan 1995 ano
16.854
+0.364
2.21%
1 jan 1996 ano
17.378
+0.524
3.11%
1 jan 1997 ano
18.234
+0.856
4.93%
1 jan 1998 ano
19.12
+0.886
4.86%
1 jan 1999 ano
20.039
+0.919
4.81%
1 jan 2000 ano
20.991
+0.952
4.75%
1 jan 2001 ano
21.977
+0.986
4.7%
1 jan 2002 ano
22.993
+1.016
4.62%
1 jan 2003 ano
24.044
+1.051
4.57%
1 jan 2004 ano
25.126
+1.082
4.5%
1 jan 2005 ano
26.242
+1.116
4.44%
1 jan 2006 ano
27.386
+1.144
4.36%
1 jan 2007 ano
28.537
+1.151
4.2%
1 jan 2008 ano
29.688
+1.151
4.03%
1 jan 2009 ano
30.839
+1.151
3.88%
1 jan 2010 ano
31.985
+1.146
3.72%
1 jan 2011 ano
33.123
+1.138
3.56%
1 jan 2012 ano
34.252
+1.129
3.41%
1 jan 2013 ano
35.368
+1.116
3.26%
1 jan 2014 ano
36.469
+1.101
3.11%
1 jan 2015 ano
37.551
+1.082
2.97%
1 jan 2016 ano
38.614
+1.063
2.83%
Classificação de países por estatísticas atuais por anos


Comentários: