29
/pt/
pt
AIzaSyAYiBZKx7MnpbEhh9jyipgxe19OcubqV5w
April 1, 2024
259123
Syrian Arab Republic
SYR
true
2
1
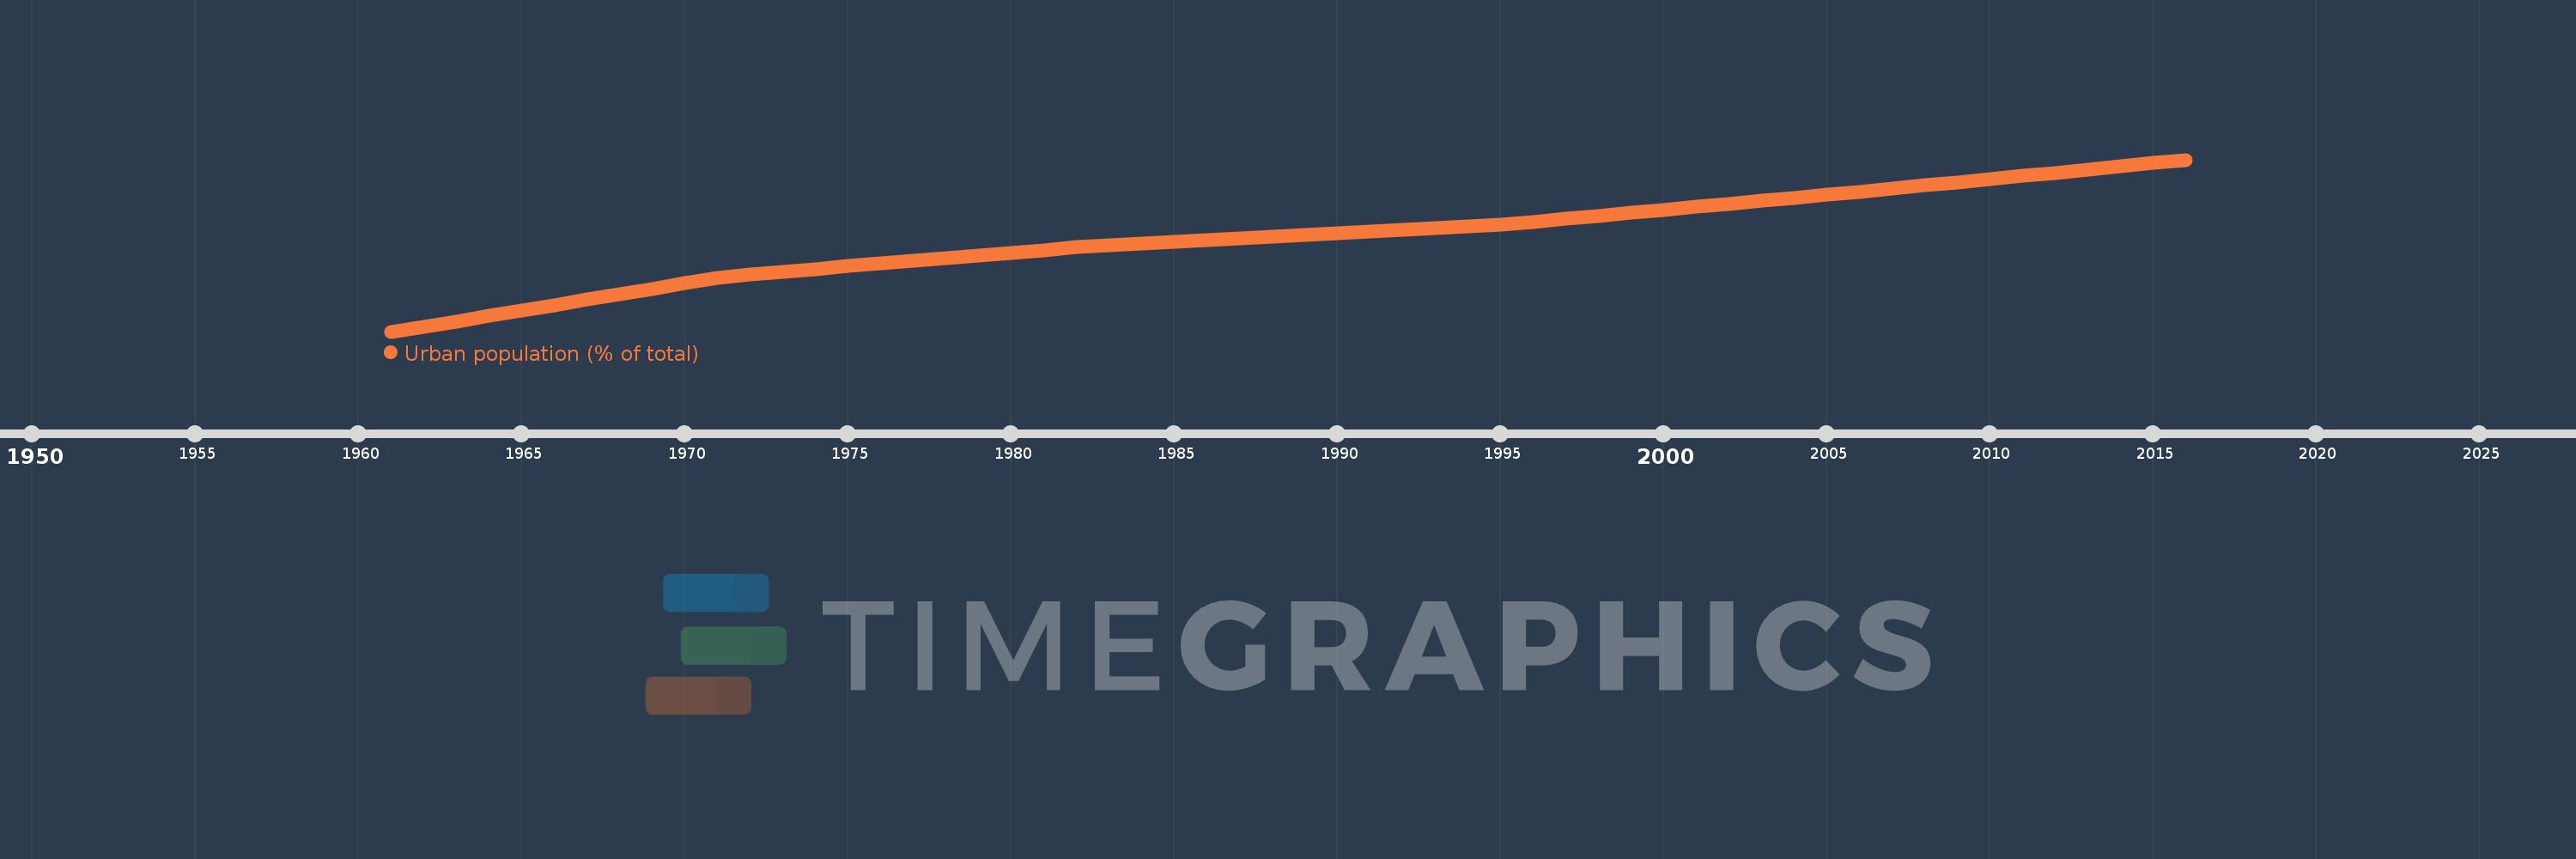
Urban population (% of total)
2016,2015,2014,2013,2012,2011,2010,2009,2008,2007,2006,2005,2004,2003,2002,2001,2000,1999,1998,1997,1996,1995,1994,1993,1992,1991,1990,1989,1988,1987,1986,1985,1984,1983,1982,1981,1980,1979,1978,1977,1976,1975,1974,1973,1972,1971,1970,1969,1968,1967,1966,1965,1964,1963,1962,1961
Estas estatísticas em outros países:
AfghanistanAlbaniaAlgeriaAmerican SamoaAndorraAngolaAntigua and BarbudaArab WorldArgentinaArmeniaArubaAustraliaAustriaAzerbaijanBahamas, TheBahrainBangladeshBarbadosBelarusBelgiumBelizeBeninBermudaBhutanBoliviaBosnia and HerzegovinaBotswanaBrazilBritish Virgin IslandsBrunei DarussalamBulgariaBurkina FasoBurundiCabo VerdeCambodiaCameroonCanadaCaribbean small statesCayman IslandsCentral African RepublicCentral Europe and the BalticsChadChannel IslandsChileChinaColombiaComorosCongo, Dem. Rep.Congo, Rep.Costa RicaCote d'IvoireCroatiaCubaCuracaoCyprusCzech RepublicDenmarkDjiboutiDominicaDominican RepublicEarly-demographic dividendEast Asia & PacificEast Asia & Pacific (excluding high income)East Asia & Pacific (IDA & IBRD countries)EcuadorEgypt, Arab Rep.El SalvadorEquatorial GuineaEritreaEstoniaEthiopiaEuro areaEurope & Central AsiaEurope & Central Asia (excluding high income)Europe & Central Asia (IDA & IBRD countries)European UnionFaroe IslandsFijiFinlandFragile and conflict affected situationsFranceFrench PolynesiaGabonGambia, TheGeorgiaGermanyGhanaGibraltarGreeceGreenlandGrenadaGuamGuatemalaGuineaGuinea-BissauGuyanaHaitiHeavily indebted poor countries (HIPC)High incomeHondurasHong Kong SAR, ChinaHungaryIBRD onlyIcelandIDA & IBRD totalIDA blendIDA onlyIDA totalIndiaIndonesiaIran, Islamic Rep.IraqIrelandIsle of ManIsraelItalyJamaicaJapanJordanKazakhstanKenyaKiribatiKorea, Dem. People’s Rep.Korea, Rep.KuwaitKyrgyz RepublicLao PDRLate-demographic dividendLatin America & Caribbean Latin America & Caribbean (excluding high income)Latin America & the Caribbean (IDA & IBRD countries)LatviaLeast developed countries: UN classificationLebanonLesothoLiberiaLibyaLiechtensteinLithuaniaLow & middle incomeLow incomeLower middle incomeLuxembourgMacao SAR, ChinaMacedonia, FYRMadagascarMalawiMalaysiaMaldivesMaliMaltaMarshall IslandsMauritaniaMauritiusMexicoMicronesia, Fed. Sts.Middle East & North AfricaMiddle East & North Africa (excluding high income)Middle East & North Africa (IDA & IBRD countries)Middle incomeMoldovaMonacoMongoliaMontenegroMoroccoMozambiqueMyanmarNamibiaNauruNepalNetherlandsNew CaledoniaNew ZealandNicaraguaNigerNigeriaNorth AmericaNorthern Mariana IslandsNorwayOECD membersOmanOther small statesPacific island small statesPakistanPalauPanamaPapua New GuineaParaguayPeruPhilippinesPolandPortugalPost-demographic dividendPre-demographic dividendPuerto RicoQatarRomaniaRussian FederationRwandaSamoaSan MarinoSao Tome and PrincipeSaudi ArabiaSenegalSerbiaSeychellesSierra LeoneSingaporeSint Maarten (Dutch part)Slovak RepublicSloveniaSmall statesSolomon IslandsSomaliaSouth AfricaSouth AsiaSouth Asia (IDA & IBRD)South SudanSpainSri LankaSt. Kitts and NevisSt. LuciaSt. Vincent and the GrenadinesSub-Saharan Africa Sub-Saharan Africa (excluding high income)Sub-Saharan Africa (IDA & IBRD countries)SudanSurinameSwazilandSwedenSwitzerlandSyrian Arab RepublicTajikistanTanzaniaThailandTimor-LesteTogoTongaTrinidad and TobagoTunisiaTurkeyTurkmenistanTurks and Caicos IslandsTuvaluUgandaUkraineUnited Arab EmiratesUnited KingdomUnited StatesUpper middle incomeUruguayUzbekistanVanuatuVenezuela, RBVietnamVirgin Islands (U.S.)West Bank and GazaWorldYemen, Rep.ZambiaZimbabwe Linha do tempo:
Nesta escala de tempo está apresentado um gráfico de 1961 ano até 2016 ano Syrian Arab Republic. Dados de 1960 ano ausente. O número de observações reais por data: 56.
Fonte (nome):
Indicadores de desenvolvimento mundial
Fonte (organização):
United Nations, World Urbanization Prospects.
Categorias:
Climate Change, Urban Development
Foi atualizado:
23 abr 2017 ano
Indicadores de alterações dos valores ao longo dos anos
Mínimo:
36.807
1 jan 1961 ano
Máximo:
57.656
1 jan 2016 ano
Na data de observação
Valor
Mudança absoluta
A alteração em relação ao valor anterior
1 jan 1961 ano
36.807
+36.807
0.0%
1 jan 1962 ano
37.399
+0.592
1.61%
1 jan 1963 ano
38.044
+0.645
1.72%
1 jan 1964 ano
38.694
+0.65
1.71%
1 jan 1965 ano
39.349
+0.655
1.69%
1 jan 1966 ano
40.006
+0.657
1.67%
1 jan 1967 ano
40.667
+0.661
1.65%
1 jan 1968 ano
41.332
+0.665
1.64%
1 jan 1969 ano
42.001
+0.669
1.62%
1 jan 1970 ano
42.671
+0.67
1.6%
1 jan 1971 ano
43.345
+0.674
1.58%
1 jan 1972 ano
43.751
+0.406
0.94%
1 jan 1973 ano
44.078
+0.327
0.75%
1 jan 1974 ano
44.405
+0.327
0.74%
1 jan 1975 ano
44.733
+0.328
0.74%
1 jan 1976 ano
45.061
+0.328
0.73%
1 jan 1977 ano
45.39
+0.329
0.73%
1 jan 1978 ano
45.718
+0.328
0.72%
1 jan 1979 ano
46.048
+0.33
0.72%
1 jan 1980 ano
46.377
+0.329
0.71%
1 jan 1981 ano
46.708
+0.331
0.71%
1 jan 1982 ano
47.038
+0.33
0.71%
1 jan 1983 ano
47.268
+0.23
0.49%
1 jan 1984 ano
47.476
+0.208
0.44%
1 jan 1985 ano
47.684
+0.208
0.44%
1 jan 1986 ano
47.891
+0.207
0.43%
1 jan 1987 ano
48.099
+0.208
0.43%
1 jan 1988 ano
48.307
+0.208
0.43%
1 jan 1989 ano
48.515
+0.208
0.43%
1 jan 1990 ano
48.723
+0.208
0.43%
1 jan 1991 ano
48.931
+0.208
0.43%
1 jan 1992 ano
49.139
+0.208
0.43%
1 jan 1993 ano
49.347
+0.208
0.42%
1 jan 1994 ano
49.555
+0.208
0.42%
1 jan 1995 ano
49.764
+0.209
0.42%
1 jan 1996 ano
50.104
+0.34
0.68%
1 jan 1997 ano
50.473
+0.369
0.74%
1 jan 1998 ano
50.841
+0.368
0.73%
1 jan 1999 ano
51.21
+0.369
0.73%
1 jan 2000 ano
51.578
+0.368
0.72%
1 jan 2001 ano
51.947
+0.369
0.72%
1 jan 2002 ano
52.314
+0.367
0.71%
1 jan 2003 ano
52.682
+0.368
0.7%
1 jan 2004 ano
53.049
+0.367
0.7%
1 jan 2005 ano
53.417
+0.368
0.69%
1 jan 2006 ano
53.783
+0.366
0.69%
1 jan 2007 ano
54.154
+0.371
0.69%
1 jan 2008 ano
54.529
+0.375
0.69%
1 jan 2009 ano
54.908
+0.379
0.7%
1 jan 2010 ano
55.29
+0.382
0.7%
1 jan 2011 ano
55.677
+0.387
0.7%
1 jan 2012 ano
56.066
+0.389
0.7%
1 jan 2013 ano
56.459
+0.393
0.7%
1 jan 2014 ano
56.855
+0.396
0.7%
1 jan 2015 ano
57.255
+0.4
0.7%
1 jan 2016 ano
57.656
+0.401
0.7%
Classificação de países por estatísticas atuais por anos


Comentários: