29
/pt/
pt
AIzaSyAYiBZKx7MnpbEhh9jyipgxe19OcubqV5w
April 1, 2024
61408
Upper middle income
UMC
false
2
1
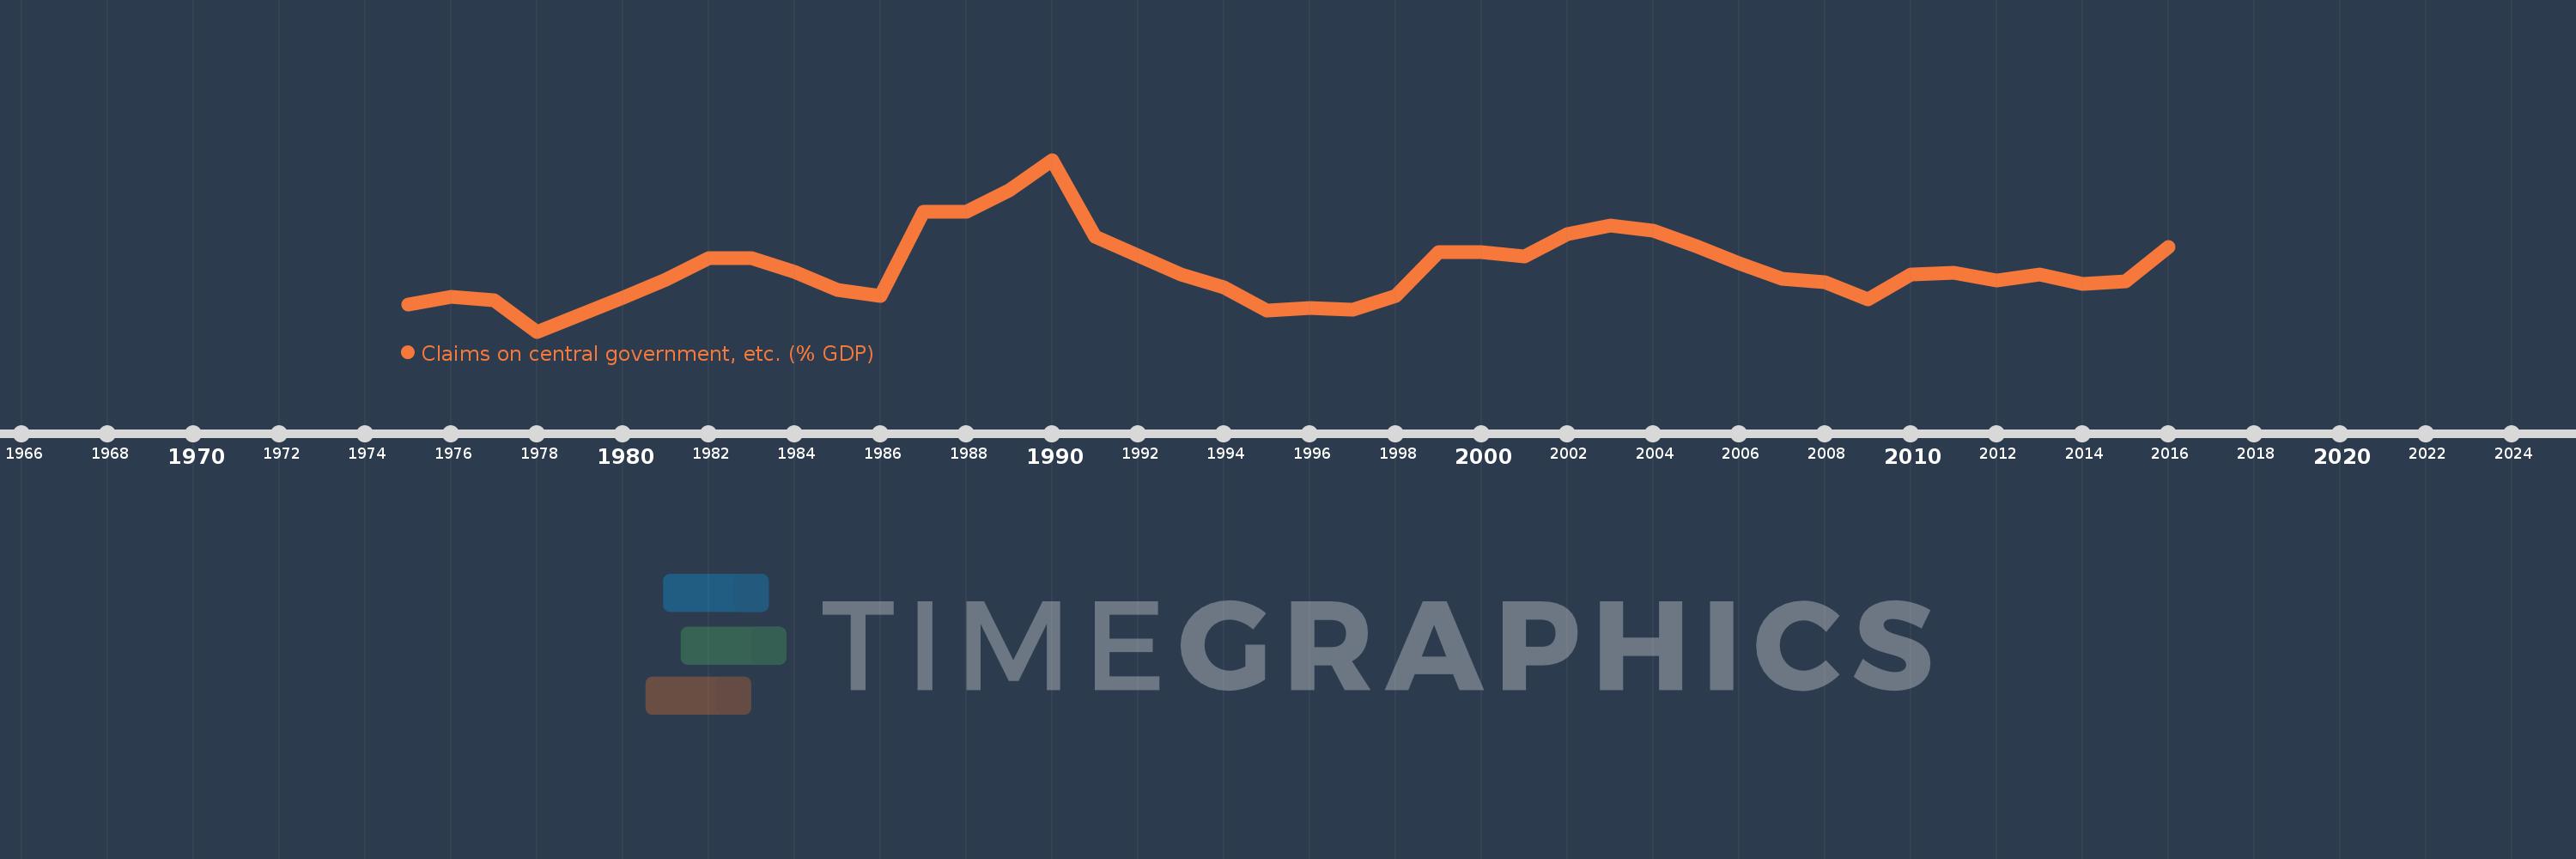
Claims on central government, etc. (% GDP)
2016,2015,2014,2013,2012,2011,2010,2009,2008,2007,2006,2005,2004,2003,2002,2001,2000,1999,1998,1997,1996,1995,1994,1993,1992,1991,1990,1989,1988,1987,1986,1985,1984,1983,1982,1981,1980,1979,1978,1977,1976,1975
Estas estatísticas em outros países:
AfghanistanAlbaniaAlgeriaAngolaAntigua and BarbudaArab WorldArgentinaArmeniaArubaAustraliaAustriaAzerbaijanBahamas, TheBahrainBangladeshBarbadosBelarusBelgiumBelizeBeninBhutanBoliviaBosnia and HerzegovinaBotswanaBrazilBrunei DarussalamBulgariaBurkina FasoBurundiCabo VerdeCambodiaCameroonCanadaCaribbean small statesCentral African RepublicCentral Europe and the BalticsChadChileChinaColombiaComorosCongo, Dem. Rep.Congo, Rep.Costa RicaCote d'IvoireCroatiaCyprusCzech RepublicDenmarkDjiboutiDominicaDominican RepublicEarly-demographic dividendEast Asia & PacificEast Asia & Pacific (excluding high income)East Asia & Pacific (IDA & IBRD countries)EcuadorEgypt, Arab Rep.El SalvadorEquatorial GuineaEritreaEstoniaEthiopiaEuro areaEurope & Central AsiaEurope & Central Asia (excluding high income)Europe & Central Asia (IDA & IBRD countries)European UnionFijiFinlandFragile and conflict affected situationsFranceGabonGambia, TheGeorgiaGermanyGhanaGreeceGrenadaGuatemalaGuineaGuinea-BissauGuyanaHaitiHeavily indebted poor countries (HIPC)High incomeHondurasHong Kong SAR, ChinaHungaryIBRD onlyIcelandIDA & IBRD totalIDA blendIDA onlyIDA totalIndiaIndonesiaIran, Islamic Rep.IraqIrelandIsraelItalyJamaicaJapanJordanKazakhstanKenyaKorea, Rep.KosovoKuwaitKyrgyz RepublicLao PDRLate-demographic dividendLatin America & Caribbean Latin America & Caribbean (excluding high income)Latin America & the Caribbean (IDA & IBRD countries)LatviaLeast developed countries: UN classificationLebanonLesothoLiberiaLibyaLithuaniaLow & middle incomeLow incomeLower middle incomeLuxembourgMacao SAR, ChinaMacedonia, FYRMadagascarMalawiMalaysiaMaldivesMaliMaltaMauritaniaMauritiusMexicoMicronesia, Fed. Sts.Middle East & North AfricaMiddle East & North Africa (excluding high income)Middle East & North Africa (IDA & IBRD countries)Middle incomeMoldovaMongoliaMontenegroMoroccoMozambiqueMyanmarNamibiaNepalNetherlandsNew ZealandNicaraguaNigerNigeriaNorth AmericaNorwayOECD membersOmanOther small statesPacific island small statesPakistanPanamaPapua New GuineaParaguayPeruPhilippinesPolandPortugalPost-demographic dividendPre-demographic dividendQatarRomaniaRussian FederationRwandaSamoaSao Tome and PrincipeSaudi ArabiaSenegalSerbiaSeychellesSierra LeoneSingaporeSlovak RepublicSloveniaSmall statesSolomon IslandsSouth AfricaSouth AsiaSouth Asia (IDA & IBRD)South SudanSpainSri LankaSt. Kitts and NevisSt. LuciaSt. Vincent and the GrenadinesSub-Saharan Africa Sub-Saharan Africa (excluding high income)Sub-Saharan Africa (IDA & IBRD countries)SudanSurinameSwazilandSwedenSwitzerlandSyrian Arab RepublicTajikistanTanzaniaThailandTimor-LesteTogoTongaTrinidad and TobagoTunisiaTurkeyUgandaUkraineUnited Arab EmiratesUnited KingdomUnited StatesUpper middle incomeUruguayVanuatuVenezuela, RBVietnamWest Bank and GazaWorldYemen, Rep.ZambiaZimbabwe Linha do tempo:
Nesta escala de tempo está apresentado um gráfico de 1975 ano até 2016 ano Upper middle income. Dados de 1974 ano ausente. O número de observações reais por data: 42.
Fonte (nome):
Indicadores de desenvolvimento mundial
Fonte (organização):
International Monetary Fund, International Financial Statistics and data files, and World Bank and OECD GDP estimates.
Categorias:
Financial Sector
Foi atualizado:
23 abr 2017 ano
Indicadores de alterações dos valores ao longo dos anos
Mínimo:
3.049
1 jan 1978 ano
Máximo:
23.969
1 jan 1990 ano
Na data de observação
Valor
Mudança absoluta
A alteração em relação ao valor anterior
1 jan 1975 ano
6.331
+6.331
0.0%
1 jan 1976 ano
7.241
+0.91
14.37%
1 jan 1977 ano
6.885
-0.356
-4.92%
1 jan 1978 ano
3.049
-3.836
-55.72%
1 jan 1979 ano
5.047
+1.998
65.53%
1 jan 1980 ano
7.225
+2.178
43.17%
1 jan 1981 ano
9.428
+2.203
30.49%
1 jan 1982 ano
12.002
+2.574
27.3%
1 jan 1983 ano
11.959
-0.043
-0.36%
1 jan 1984 ano
10.351
-1.608
-13.45%
1 jan 1985 ano
8.119
-2.232
-21.56%
1 jan 1986 ano
7.388
-0.731
-9.0%
1 jan 1987 ano
17.662
+10.274
139.06%
1 jan 1988 ano
17.634
-0.028
-0.16%
1 jan 1989 ano
20.259
+2.625
14.88%
1 jan 1990 ano
23.969
+3.711
18.32%
1 jan 1991 ano
14.631
-9.338
-38.96%
1 jan 1992 ano
12.255
-2.376
-16.24%
1 jan 1993 ano
9.959
-2.296
-18.73%
1 jan 1994 ano
8.387
-1.573
-15.79%
1 jan 1995 ano
5.57
-2.816
-33.58%
1 jan 1996 ano
5.962
+0.391
7.02%
1 jan 1997 ano
5.714
-0.248
-4.16%
1 jan 1998 ano
7.415
+1.701
29.78%
1 jan 1999 ano
12.685
+5.27
71.08%
1 jan 2000 ano
12.759
+0.073
0.58%
1 jan 2001 ano
12.202
-0.556
-4.36%
1 jan 2002 ano
14.923
+2.72
22.29%
1 jan 2003 ano
15.98
+1.058
7.09%
1 jan 2004 ano
15.302
-0.679
-4.25%
1 jan 2005 ano
13.433
-1.869
-12.21%
1 jan 2006 ano
11.401
-2.032
-15.13%
1 jan 2007 ano
9.472
-1.929
-16.92%
1 jan 2008 ano
9.065
-0.407
-4.3%
1 jan 2009 ano
6.936
-2.129
-23.48%
1 jan 2010 ano
9.962
+3.026
43.62%
1 jan 2011 ano
10.259
+0.297
2.98%
1 jan 2012 ano
9.236
-1.023
-9.97%
1 jan 2013 ano
9.958
+0.722
7.81%
1 jan 2014 ano
8.906
-1.051
-10.56%
1 jan 2015 ano
9.162
+0.256
2.87%
1 jan 2016 ano
13.335
+4.173
45.55%
Classificação de países por estatísticas atuais por anos


Comentários: