29
/pt/
pt
AIzaSyAYiBZKx7MnpbEhh9jyipgxe19OcubqV5w
April 1, 2024
211454
Niger
NER
true
2
1
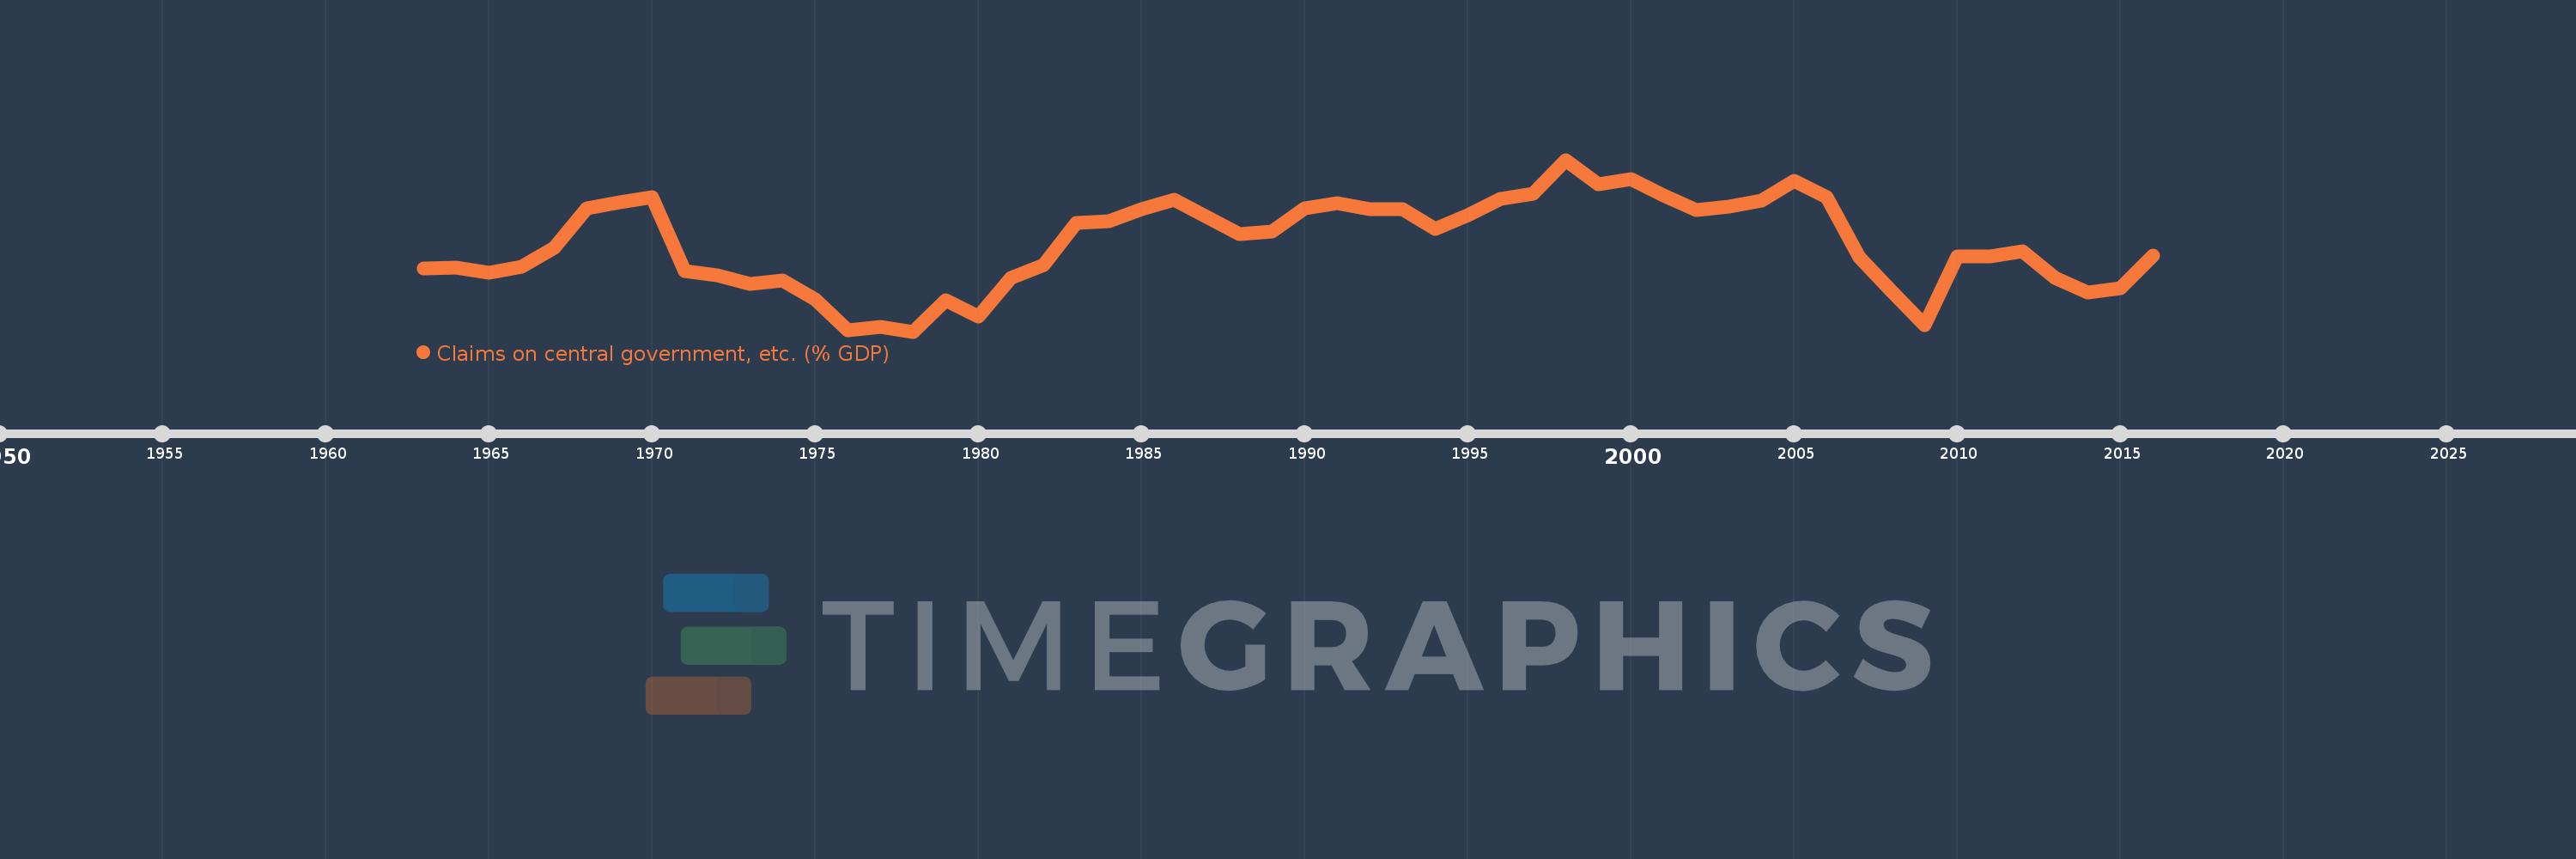
Claims on central government, etc. (% GDP)
2016,2015,2014,2013,2012,2011,2010,2009,2008,2007,2006,2005,2004,2003,2002,2001,2000,1999,1998,1997,1996,1995,1994,1993,1992,1991,1990,1989,1988,1987,1986,1985,1984,1983,1982,1981,1980,1979,1978,1977,1976,1975,1974,1973,1972,1971,1970,1969,1968,1967,1966,1965,1964,1963
Estas estatísticas em outros países:
AfghanistanAlbaniaAlgeriaAngolaAntigua and BarbudaArab WorldArgentinaArmeniaArubaAustraliaAustriaAzerbaijanBahamas, TheBahrainBangladeshBarbadosBelarusBelgiumBelizeBeninBhutanBoliviaBosnia and HerzegovinaBotswanaBrazilBrunei DarussalamBulgariaBurkina FasoBurundiCabo VerdeCambodiaCameroonCanadaCaribbean small statesCentral African RepublicCentral Europe and the BalticsChadChileChinaColombiaComorosCongo, Dem. Rep.Congo, Rep.Costa RicaCote d'IvoireCroatiaCyprusCzech RepublicDenmarkDjiboutiDominicaDominican RepublicEarly-demographic dividendEast Asia & PacificEast Asia & Pacific (excluding high income)East Asia & Pacific (IDA & IBRD countries)EcuadorEgypt, Arab Rep.El SalvadorEquatorial GuineaEritreaEstoniaEthiopiaEuro areaEurope & Central AsiaEurope & Central Asia (excluding high income)Europe & Central Asia (IDA & IBRD countries)European UnionFijiFinlandFragile and conflict affected situationsFranceGabonGambia, TheGeorgiaGermanyGhanaGreeceGrenadaGuatemalaGuineaGuinea-BissauGuyanaHaitiHeavily indebted poor countries (HIPC)High incomeHondurasHong Kong SAR, ChinaHungaryIBRD onlyIcelandIDA & IBRD totalIDA blendIDA onlyIDA totalIndiaIndonesiaIran, Islamic Rep.IraqIrelandIsraelItalyJamaicaJapanJordanKazakhstanKenyaKorea, Rep.KosovoKuwaitKyrgyz RepublicLao PDRLate-demographic dividendLatin America & Caribbean Latin America & Caribbean (excluding high income)Latin America & the Caribbean (IDA & IBRD countries)LatviaLeast developed countries: UN classificationLebanonLesothoLiberiaLibyaLithuaniaLow & middle incomeLow incomeLower middle incomeLuxembourgMacao SAR, ChinaMacedonia, FYRMadagascarMalawiMalaysiaMaldivesMaliMaltaMauritaniaMauritiusMexicoMicronesia, Fed. Sts.Middle East & North AfricaMiddle East & North Africa (excluding high income)Middle East & North Africa (IDA & IBRD countries)Middle incomeMoldovaMongoliaMontenegroMoroccoMozambiqueMyanmarNamibiaNepalNetherlandsNew ZealandNicaraguaNigerNigeriaNorth AmericaNorwayOECD membersOmanOther small statesPacific island small statesPakistanPanamaPapua New GuineaParaguayPeruPhilippinesPolandPortugalPost-demographic dividendPre-demographic dividendQatarRomaniaRussian FederationRwandaSamoaSao Tome and PrincipeSaudi ArabiaSenegalSerbiaSeychellesSierra LeoneSingaporeSlovak RepublicSloveniaSmall statesSolomon IslandsSouth AfricaSouth AsiaSouth Asia (IDA & IBRD)South SudanSpainSri LankaSt. Kitts and NevisSt. LuciaSt. Vincent and the GrenadinesSub-Saharan Africa Sub-Saharan Africa (excluding high income)Sub-Saharan Africa (IDA & IBRD countries)SudanSurinameSwazilandSwedenSwitzerlandSyrian Arab RepublicTajikistanTanzaniaThailandTimor-LesteTogoTongaTrinidad and TobagoTunisiaTurkeyUgandaUkraineUnited Arab EmiratesUnited KingdomUnited StatesUpper middle incomeUruguayVanuatuVenezuela, RBVietnamWest Bank and GazaWorldYemen, Rep.ZambiaZimbabwe Linha do tempo:
Nesta escala de tempo está apresentado um gráfico de 1963 ano até 2016 ano Niger. Dados de 1962 ano ausente. O número de observações reais por data: 54.
Fonte (nome):
Indicadores de desenvolvimento mundial
Fonte (organização):
International Monetary Fund, International Financial Statistics and data files, and World Bank and OECD GDP estimates.
Categorias:
Financial Sector
Foi atualizado:
23 abr 2017 ano
Indicadores de alterações dos valores ao longo dos anos
Mínimo:
-5.172
1 jan 1978 ano
Máximo:
6.915
1 jan 1998 ano
Na data de observação
Valor
Mudança absoluta
A alteração em relação ao valor anterior
1 jan 1963 ano
-0.729
-0.729
0.0%
1 jan 1964 ano
-0.661
+0.068
-9.31%
1 jan 1965 ano
-1.043
-0.382
57.77%
1 jan 1966 ano
-0.624
+0.419
-40.18%
1 jan 1967 ano
0.695
+1.32
-211.43%
1 jan 1968 ano
3.5
+2.804
403.18%
1 jan 1969 ano
3.946
+0.447
12.76%
1 jan 1970 ano
4.281
+0.335
8.49%
1 jan 1971 ano
-0.914
-5.196
-121.36%
1 jan 1972 ano
-1.217
-0.302
33.08%
1 jan 1973 ano
-1.79
-0.573
47.06%
1 jan 1974 ano
-1.56
+0.23
-12.84%
1 jan 1975 ano
-2.895
-1.335
85.63%
1 jan 1976 ano
-5.111
-2.216
76.54%
1 jan 1977 ano
-4.846
+0.265
-5.19%
1 jan 1978 ano
-5.172
-0.326
6.73%
1 jan 1979 ano
-2.966
+2.206
-42.65%
1 jan 1980 ano
-4.092
-1.126
37.95%
1 jan 1981 ano
-1.414
+2.678
-65.45%
1 jan 1982 ano
-0.506
+0.908
-64.23%
1 jan 1983 ano
2.464
+2.97
-587.29%
1 jan 1984 ano
2.599
+0.135
5.48%
1 jan 1985 ano
3.447
+0.848
32.62%
1 jan 1986 ano
4.109
+0.662
19.21%
1 jan 1987 ano
2.898
-1.212
-29.48%
1 jan 1988 ano
1.692
-1.206
-41.61%
1 jan 1989 ano
1.877
+0.185
10.92%
1 jan 1990 ano
3.486
+1.609
85.76%
1 jan 1991 ano
3.879
+0.393
11.26%
1 jan 1992 ano
3.455
-0.424
-10.93%
1 jan 1993 ano
3.441
-0.014
-0.4%
1 jan 1994 ano
2.055
-1.385
-40.26%
1 jan 1995 ano
3.01
+0.955
46.44%
1 jan 1996 ano
4.179
+1.17
38.86%
1 jan 1997 ano
4.522
+0.343
8.2%
1 jan 1998 ano
6.915
+2.393
52.91%
1 jan 1999 ano
5.201
-1.714
-24.79%
1 jan 2000 ano
5.547
+0.346
6.66%
1 jan 2001 ano
4.389
-1.158
-20.88%
1 jan 2002 ano
3.368
-1.021
-23.26%
1 jan 2003 ano
3.627
+0.259
7.69%
1 jan 2004 ano
4.03
+0.404
11.13%
1 jan 2005 ano
5.427
+1.396
34.65%
1 jan 2006 ano
4.285
-1.141
-21.03%
1 jan 2007 ano
0.046
-4.239
-98.93%
1 jan 2008 ano
-2.385
-2.431
-5.28 mil%
1 jan 2009 ano
-4.746
-2.361
98.98%
1 jan 2010 ano
0.093
+4.839
-101.96%
1 jan 2011 ano
0.092
-0.001
-0.54%
1 jan 2012 ano
0.469
+0.377
407.79%
1 jan 2013 ano
-1.38
-1.849
-394.29%
1 jan 2014 ano
-2.429
-1.049
76.05%
1 jan 2015 ano
-2.135
+0.294
-12.12%
1 jan 2016 ano
0.17
+2.305
-107.95%
Classificação de países por estatísticas atuais por anos


Comentários: