29
/pt/
pt
AIzaSyAYiBZKx7MnpbEhh9jyipgxe19OcubqV5w
April 1, 2024
109415
Congo, Dem. Rep.
COD
true
2
1
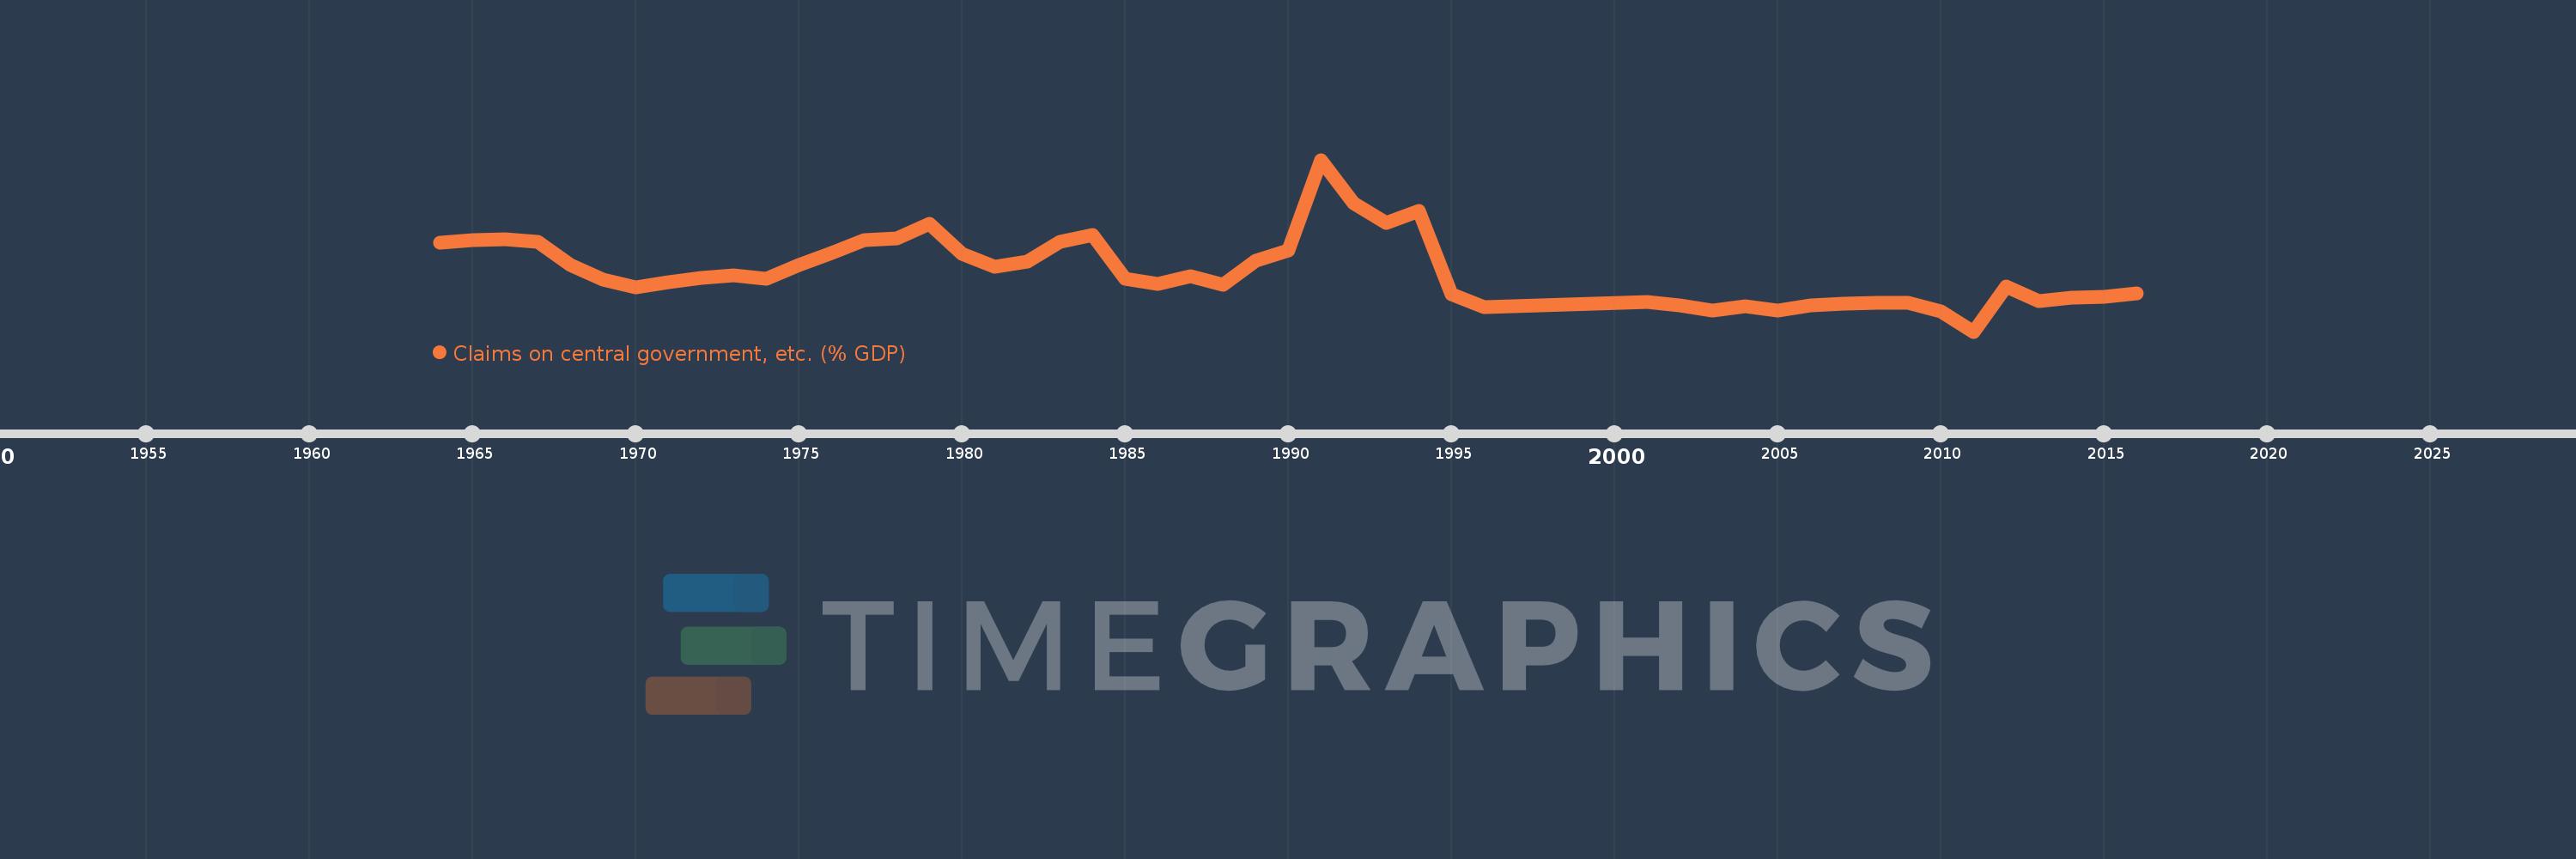
Claims on central government, etc. (% GDP)
2016,2015,2014,2013,2012,2011,2010,2009,2008,2007,2006,2005,2004,2003,2002,2001,1996,1995,1994,1993,1992,1991,1990,1989,1988,1987,1986,1985,1984,1983,1982,1981,1980,1979,1978,1977,1976,1975,1974,1973,1972,1971,1970,1969,1968,1967,1966,1965,1964
Estas estatísticas em outros países:
AfghanistanAlbaniaAlgeriaAngolaAntigua and BarbudaArab WorldArgentinaArmeniaArubaAustraliaAustriaAzerbaijanBahamas, TheBahrainBangladeshBarbadosBelarusBelgiumBelizeBeninBhutanBoliviaBosnia and HerzegovinaBotswanaBrazilBrunei DarussalamBulgariaBurkina FasoBurundiCabo VerdeCambodiaCameroonCanadaCaribbean small statesCentral African RepublicCentral Europe and the BalticsChadChileChinaColombiaComorosCongo, Dem. Rep.Congo, Rep.Costa RicaCote d'IvoireCroatiaCyprusCzech RepublicDenmarkDjiboutiDominicaDominican RepublicEarly-demographic dividendEast Asia & PacificEast Asia & Pacific (excluding high income)East Asia & Pacific (IDA & IBRD countries)EcuadorEgypt, Arab Rep.El SalvadorEquatorial GuineaEritreaEstoniaEthiopiaEuro areaEurope & Central AsiaEurope & Central Asia (excluding high income)Europe & Central Asia (IDA & IBRD countries)European UnionFijiFinlandFragile and conflict affected situationsFranceGabonGambia, TheGeorgiaGermanyGhanaGreeceGrenadaGuatemalaGuineaGuinea-BissauGuyanaHaitiHeavily indebted poor countries (HIPC)High incomeHondurasHong Kong SAR, ChinaHungaryIBRD onlyIcelandIDA & IBRD totalIDA blendIDA onlyIDA totalIndiaIndonesiaIran, Islamic Rep.IraqIrelandIsraelItalyJamaicaJapanJordanKazakhstanKenyaKorea, Rep.KosovoKuwaitKyrgyz RepublicLao PDRLate-demographic dividendLatin America & Caribbean Latin America & Caribbean (excluding high income)Latin America & the Caribbean (IDA & IBRD countries)LatviaLeast developed countries: UN classificationLebanonLesothoLiberiaLibyaLithuaniaLow & middle incomeLow incomeLower middle incomeLuxembourgMacao SAR, ChinaMacedonia, FYRMadagascarMalawiMalaysiaMaldivesMaliMaltaMauritaniaMauritiusMexicoMicronesia, Fed. Sts.Middle East & North AfricaMiddle East & North Africa (excluding high income)Middle East & North Africa (IDA & IBRD countries)Middle incomeMoldovaMongoliaMontenegroMoroccoMozambiqueMyanmarNamibiaNepalNetherlandsNew ZealandNicaraguaNigerNigeriaNorth AmericaNorwayOECD membersOmanOther small statesPacific island small statesPakistanPanamaPapua New GuineaParaguayPeruPhilippinesPolandPortugalPost-demographic dividendPre-demographic dividendQatarRomaniaRussian FederationRwandaSamoaSao Tome and PrincipeSaudi ArabiaSenegalSerbiaSeychellesSierra LeoneSingaporeSlovak RepublicSloveniaSmall statesSolomon IslandsSouth AfricaSouth AsiaSouth Asia (IDA & IBRD)South SudanSpainSri LankaSt. Kitts and NevisSt. LuciaSt. Vincent and the GrenadinesSub-Saharan Africa Sub-Saharan Africa (excluding high income)Sub-Saharan Africa (IDA & IBRD countries)SudanSurinameSwazilandSwedenSwitzerlandSyrian Arab RepublicTajikistanTanzaniaThailandTimor-LesteTogoTongaTrinidad and TobagoTunisiaTurkeyUgandaUkraineUnited Arab EmiratesUnited KingdomUnited StatesUpper middle incomeUruguayVanuatuVenezuela, RBVietnamWest Bank and GazaWorldYemen, Rep.ZambiaZimbabwe Linha do tempo:
Nesta escala de tempo está apresentado um gráfico de 1964 ano até 2016 ano Congo, Dem. Rep.. Dados de 1963 ano ausente. O número de observações reais por data: 49.
Fonte (nome):
Indicadores de desenvolvimento mundial
Fonte (organização):
International Monetary Fund, International Financial Statistics and data files, and World Bank and OECD GDP estimates.
Categorias:
Financial Sector
Foi atualizado:
23 abr 2017 ano
Indicadores de alterações dos valores ao longo dos anos
Mínimo:
-3.541
1 jan 2011 ano
Máximo:
23.042
1 jan 1991 ano
Na data de observação
Valor
Mudança absoluta
A alteração em relação ao valor anterior
1 jan 1964 ano
10.199
+10.199
0.0%
1 jan 1965 ano
10.663
+0.465
4.56%
1 jan 1966 ano
10.716
+0.052
0.49%
1 jan 1967 ano
10.376
-0.34
-3.17%
1 jan 1968 ano
6.779
-3.597
-34.67%
1 jan 1969 ano
4.513
-2.266
-33.42%
1 jan 1970 ano
3.25
-1.263
-27.99%
1 jan 1971 ano
4.05
+0.8
24.61%
1 jan 1972 ano
4.726
+0.677
16.71%
1 jan 1973 ano
5.119
+0.392
8.3%
1 jan 1974 ano
4.662
-0.457
-8.92%
1 jan 1975 ano
6.706
+2.044
43.85%
1 jan 1976 ano
8.635
+1.929
28.77%
1 jan 1977 ano
10.562
+1.927
22.31%
1 jan 1978 ano
10.937
+0.375
3.55%
1 jan 1979 ano
13.119
+2.182
19.95%
1 jan 1980 ano
8.46
-4.659
-35.51%
1 jan 1981 ano
6.481
-1.979
-23.39%
1 jan 1982 ano
7.321
+0.84
12.96%
1 jan 1983 ano
10.348
+3.027
41.34%
1 jan 1984 ano
11.452
+1.104
10.67%
1 jan 1985 ano
4.611
-6.841
-59.74%
1 jan 1986 ano
3.895
-0.716
-15.52%
1 jan 1987 ano
4.986
+1.091
28.01%
1 jan 1988 ano
3.766
-1.22
-24.47%
1 jan 1989 ano
7.404
+3.638
96.6%
1 jan 1990 ano
9.069
+1.666
22.5%
1 jan 1991 ano
23.042
+13.972
154.06%
1 jan 1992 ano
16.383
-6.658
-28.9%
1 jan 1993 ano
13.338
-3.045
-18.59%
1 jan 1994 ano
15.124
+1.786
13.39%
1 jan 1995 ano
2.241
-12.884
-85.19%
1 jan 1996 ano
0.276
-1.964
-87.67%
1 jan 2001 ano
1.038
+0.761
275.72%
1 jan 2002 ano
0.526
-0.512
-49.35%
1 jan 2003 ano
-0.312
-0.838
-159.39%
1 jan 2004 ano
0.346
+0.658
-210.92%
1 jan 2005 ano
-0.334
-0.68
-196.33%
1 jan 2006 ano
0.499
+0.833
-249.72%
1 jan 2007 ano
0.731
+0.232
46.38%
1 jan 2008 ano
0.865
+0.134
18.36%
1 jan 2009 ano
0.846
-0.019
-2.25%
1 jan 2010 ano
-0.474
-1.32
-156.1%
1 jan 2011 ano
-3.541
-3.067
646.39%
1 jan 2012 ano
3.493
+7.034
-198.63%
1 jan 2013 ano
1.205
-2.288
-65.51%
1 jan 2014 ano
1.675
+0.471
39.06%
1 jan 2015 ano
1.803
+0.128
7.64%
1 jan 2016 ano
2.423
+0.62
34.37%
Classificação de países por estatísticas atuais por anos


Comentários: