29
/pt/
pt
AIzaSyAYiBZKx7MnpbEhh9jyipgxe19OcubqV5w
April 1, 2024
195287
Mexico
MEX
true
2
1
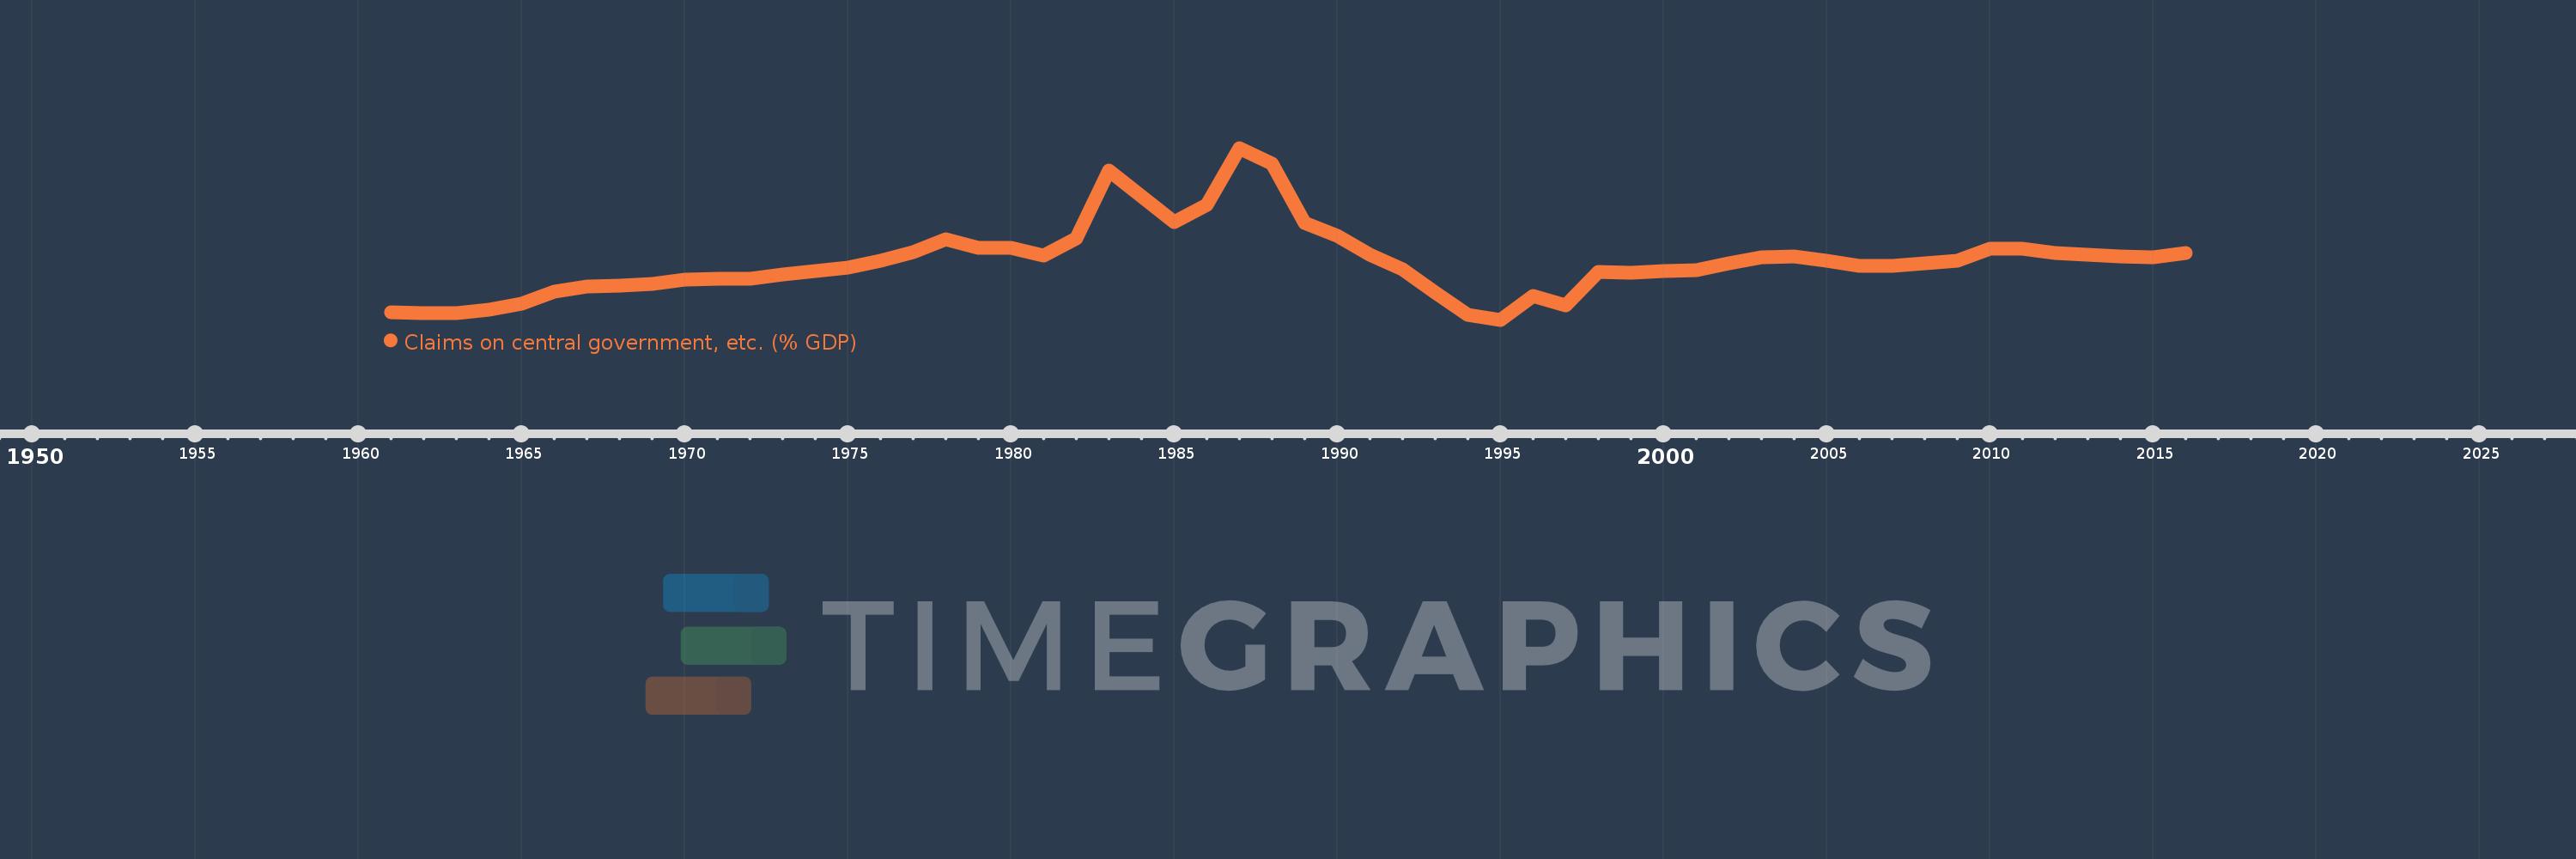
Claims on central government, etc. (% GDP)
2016,2015,2014,2013,2012,2011,2010,2009,2008,2007,2006,2005,2004,2003,2002,2001,2000,1999,1998,1997,1996,1995,1994,1993,1992,1991,1990,1989,1988,1987,1986,1985,1984,1983,1982,1981,1980,1979,1978,1977,1976,1975,1974,1973,1972,1971,1970,1969,1968,1967,1966,1965,1964,1963,1962,1961
Estas estatísticas em outros países:
AfghanistanAlbaniaAlgeriaAngolaAntigua and BarbudaArab WorldArgentinaArmeniaArubaAustraliaAustriaAzerbaijanBahamas, TheBahrainBangladeshBarbadosBelarusBelgiumBelizeBeninBhutanBoliviaBosnia and HerzegovinaBotswanaBrazilBrunei DarussalamBulgariaBurkina FasoBurundiCabo VerdeCambodiaCameroonCanadaCaribbean small statesCentral African RepublicCentral Europe and the BalticsChadChileChinaColombiaComorosCongo, Dem. Rep.Congo, Rep.Costa RicaCote d'IvoireCroatiaCyprusCzech RepublicDenmarkDjiboutiDominicaDominican RepublicEarly-demographic dividendEast Asia & PacificEast Asia & Pacific (excluding high income)East Asia & Pacific (IDA & IBRD countries)EcuadorEgypt, Arab Rep.El SalvadorEquatorial GuineaEritreaEstoniaEthiopiaEuro areaEurope & Central AsiaEurope & Central Asia (excluding high income)Europe & Central Asia (IDA & IBRD countries)European UnionFijiFinlandFragile and conflict affected situationsFranceGabonGambia, TheGeorgiaGermanyGhanaGreeceGrenadaGuatemalaGuineaGuinea-BissauGuyanaHaitiHeavily indebted poor countries (HIPC)High incomeHondurasHong Kong SAR, ChinaHungaryIBRD onlyIcelandIDA & IBRD totalIDA blendIDA onlyIDA totalIndiaIndonesiaIran, Islamic Rep.IraqIrelandIsraelItalyJamaicaJapanJordanKazakhstanKenyaKorea, Rep.KosovoKuwaitKyrgyz RepublicLao PDRLate-demographic dividendLatin America & Caribbean Latin America & Caribbean (excluding high income)Latin America & the Caribbean (IDA & IBRD countries)LatviaLeast developed countries: UN classificationLebanonLesothoLiberiaLibyaLithuaniaLow & middle incomeLow incomeLower middle incomeLuxembourgMacao SAR, ChinaMacedonia, FYRMadagascarMalawiMalaysiaMaldivesMaliMaltaMauritaniaMauritiusMexicoMicronesia, Fed. Sts.Middle East & North AfricaMiddle East & North Africa (excluding high income)Middle East & North Africa (IDA & IBRD countries)Middle incomeMoldovaMongoliaMontenegroMoroccoMozambiqueMyanmarNamibiaNepalNetherlandsNew ZealandNicaraguaNigerNigeriaNorth AmericaNorwayOECD membersOmanOther small statesPacific island small statesPakistanPanamaPapua New GuineaParaguayPeruPhilippinesPolandPortugalPost-demographic dividendPre-demographic dividendQatarRomaniaRussian FederationRwandaSamoaSao Tome and PrincipeSaudi ArabiaSenegalSerbiaSeychellesSierra LeoneSingaporeSlovak RepublicSloveniaSmall statesSolomon IslandsSouth AfricaSouth AsiaSouth Asia (IDA & IBRD)South SudanSpainSri LankaSt. Kitts and NevisSt. LuciaSt. Vincent and the GrenadinesSub-Saharan Africa Sub-Saharan Africa (excluding high income)Sub-Saharan Africa (IDA & IBRD countries)SudanSurinameSwazilandSwedenSwitzerlandSyrian Arab RepublicTajikistanTanzaniaThailandTimor-LesteTogoTongaTrinidad and TobagoTunisiaTurkeyUgandaUkraineUnited Arab EmiratesUnited KingdomUnited StatesUpper middle incomeUruguayVanuatuVenezuela, RBVietnamWest Bank and GazaWorldYemen, Rep.ZambiaZimbabwe Linha do tempo:
Nesta escala de tempo está apresentado um gráfico de 1961 ano até 2016 ano Mexico. Dados de 1960 ano ausente. O número de observações reais por data: 56.
Fonte (nome):
Indicadores de desenvolvimento mundial
Fonte (organização):
International Monetary Fund, International Financial Statistics and data files, and World Bank and OECD GDP estimates.
Categorias:
Financial Sector
Foi atualizado:
23 abr 2017 ano
Indicadores de alterações dos valores ao longo dos anos
Mínimo:
1.601
1 jan 1995 ano
Máximo:
39.657
1 jan 1987 ano
Na data de observação
Valor
Mudança absoluta
A alteração em relação ao valor anterior
1 jan 1961 ano
3.297
+3.297
0.0%
1 jan 1962 ano
3.131
-0.165
-5.01%
1 jan 1963 ano
2.991
-0.141
-4.49%
1 jan 1964 ano
3.906
+0.916
30.62%
1 jan 1965 ano
5.166
+1.259
32.24%
1 jan 1966 ano
7.89
+2.724
52.74%
1 jan 1967 ano
9.05
+1.159
14.69%
1 jan 1968 ano
9.098
+0.048
0.53%
1 jan 1969 ano
9.601
+0.503
5.53%
1 jan 1970 ano
10.476
+0.875
9.12%
1 jan 1971 ano
10.635
+0.159
1.52%
1 jan 1972 ano
10.594
-0.042
-0.39%
1 jan 1973 ano
11.567
+0.973
9.18%
1 jan 1974 ano
12.361
+0.794
6.87%
1 jan 1975 ano
13.192
+0.831
6.72%
1 jan 1976 ano
14.581
+1.389
10.53%
1 jan 1977 ano
16.504
+1.923
13.18%
1 jan 1978 ano
19.5
+2.996
18.15%
1 jan 1979 ano
17.468
-2.032
-10.42%
1 jan 1980 ano
17.506
+0.038
0.22%
1 jan 1981 ano
15.749
-1.757
-10.04%
1 jan 1982 ano
19.698
+3.949
25.08%
1 jan 1983 ano
34.569
+14.871
75.49%
1 jan 1984 ano
28.928
-5.641
-16.32%
1 jan 1985 ano
23.328
-5.6
-19.36%
1 jan 1986 ano
27.02
+3.692
15.83%
1 jan 1987 ano
39.657
+12.637
46.77%
1 jan 1988 ano
36.212
-3.446
-8.69%
1 jan 1989 ano
22.968
-13.244
-36.57%
1 jan 1990 ano
20.258
-2.709
-11.8%
1 jan 1991 ano
16.094
-4.164
-20.55%
1 jan 1992 ano
12.854
-3.24
-20.13%
1 jan 1993 ano
7.546
-5.309
-41.3%
1 jan 1994 ano
2.687
-4.859
-64.39%
1 jan 1995 ano
1.601
-1.087
-40.43%
1 jan 1996 ano
6.965
+5.364
335.12%
1 jan 1997 ano
4.754
-2.21
-31.74%
1 jan 1998 ano
12.158
+7.404
155.73%
1 jan 1999 ano
11.936
-0.223
-1.83%
1 jan 2000 ano
12.475
+0.539
4.51%
1 jan 2001 ano
12.624
+0.149
1.2%
1 jan 2002 ano
14.189
+1.565
12.4%
1 jan 2003 ano
15.523
+1.334
9.4%
1 jan 2004 ano
15.716
+0.193
1.24%
1 jan 2005 ano
14.625
-1.091
-6.94%
1 jan 2006 ano
13.586
-1.038
-7.1%
1 jan 2007 ano
13.626
+0.039
0.29%
1 jan 2008 ano
14.039
+0.414
3.04%
1 jan 2009 ano
14.729
+0.689
4.91%
1 jan 2010 ano
17.289
+2.561
17.39%
1 jan 2011 ano
17.356
+0.066
0.38%
1 jan 2012 ano
16.35
-1.006
-5.79%
1 jan 2013 ano
16.086
-0.264
-1.62%
1 jan 2014 ano
15.601
-0.485
-3.01%
1 jan 2015 ano
15.51
-0.091
-0.58%
1 jan 2016 ano
16.387
+0.877
5.66%
Classificação de países por estatísticas atuais por anos


Comentários: