29
/pt/
pt
AIzaSyAYiBZKx7MnpbEhh9jyipgxe19OcubqV5w
April 1, 2024
193967
Mauritius
MUS
true
2
1
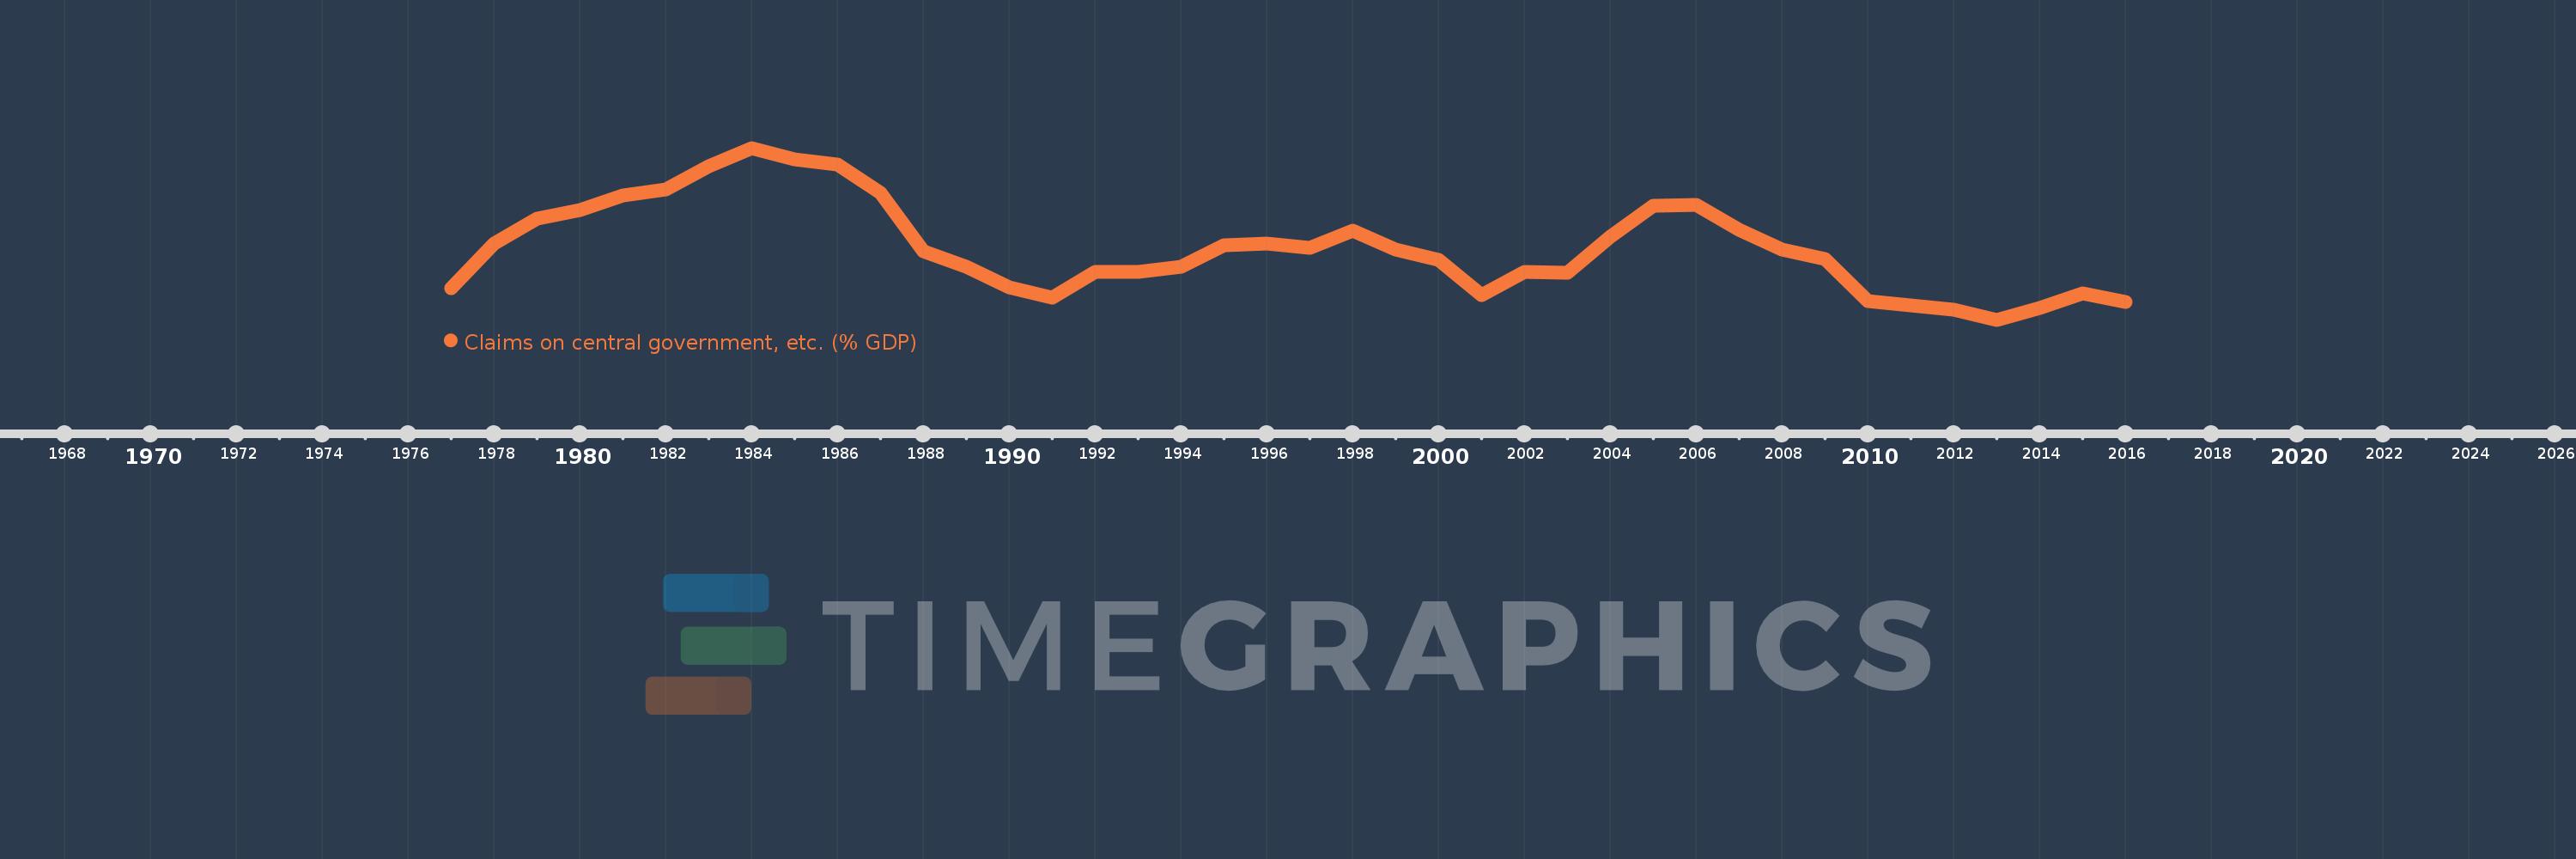
Claims on central government, etc. (% GDP)
2016,2015,2014,2013,2012,2011,2010,2009,2008,2007,2006,2005,2004,2003,2002,2001,2000,1999,1998,1997,1996,1995,1994,1993,1992,1991,1990,1989,1988,1987,1986,1985,1984,1983,1982,1981,1980,1979,1978,1977
Estas estatísticas em outros países:
AfghanistanAlbaniaAlgeriaAngolaAntigua and BarbudaArab WorldArgentinaArmeniaArubaAustraliaAustriaAzerbaijanBahamas, TheBahrainBangladeshBarbadosBelarusBelgiumBelizeBeninBhutanBoliviaBosnia and HerzegovinaBotswanaBrazilBrunei DarussalamBulgariaBurkina FasoBurundiCabo VerdeCambodiaCameroonCanadaCaribbean small statesCentral African RepublicCentral Europe and the BalticsChadChileChinaColombiaComorosCongo, Dem. Rep.Congo, Rep.Costa RicaCote d'IvoireCroatiaCyprusCzech RepublicDenmarkDjiboutiDominicaDominican RepublicEarly-demographic dividendEast Asia & PacificEast Asia & Pacific (excluding high income)East Asia & Pacific (IDA & IBRD countries)EcuadorEgypt, Arab Rep.El SalvadorEquatorial GuineaEritreaEstoniaEthiopiaEuro areaEurope & Central AsiaEurope & Central Asia (excluding high income)Europe & Central Asia (IDA & IBRD countries)European UnionFijiFinlandFragile and conflict affected situationsFranceGabonGambia, TheGeorgiaGermanyGhanaGreeceGrenadaGuatemalaGuineaGuinea-BissauGuyanaHaitiHeavily indebted poor countries (HIPC)High incomeHondurasHong Kong SAR, ChinaHungaryIBRD onlyIcelandIDA & IBRD totalIDA blendIDA onlyIDA totalIndiaIndonesiaIran, Islamic Rep.IraqIrelandIsraelItalyJamaicaJapanJordanKazakhstanKenyaKorea, Rep.KosovoKuwaitKyrgyz RepublicLao PDRLate-demographic dividendLatin America & Caribbean Latin America & Caribbean (excluding high income)Latin America & the Caribbean (IDA & IBRD countries)LatviaLeast developed countries: UN classificationLebanonLesothoLiberiaLibyaLithuaniaLow & middle incomeLow incomeLower middle incomeLuxembourgMacao SAR, ChinaMacedonia, FYRMadagascarMalawiMalaysiaMaldivesMaliMaltaMauritaniaMauritiusMexicoMicronesia, Fed. Sts.Middle East & North AfricaMiddle East & North Africa (excluding high income)Middle East & North Africa (IDA & IBRD countries)Middle incomeMoldovaMongoliaMontenegroMoroccoMozambiqueMyanmarNamibiaNepalNetherlandsNew ZealandNicaraguaNigerNigeriaNorth AmericaNorwayOECD membersOmanOther small statesPacific island small statesPakistanPanamaPapua New GuineaParaguayPeruPhilippinesPolandPortugalPost-demographic dividendPre-demographic dividendQatarRomaniaRussian FederationRwandaSamoaSao Tome and PrincipeSaudi ArabiaSenegalSerbiaSeychellesSierra LeoneSingaporeSlovak RepublicSloveniaSmall statesSolomon IslandsSouth AfricaSouth AsiaSouth Asia (IDA & IBRD)South SudanSpainSri LankaSt. Kitts and NevisSt. LuciaSt. Vincent and the GrenadinesSub-Saharan Africa Sub-Saharan Africa (excluding high income)Sub-Saharan Africa (IDA & IBRD countries)SudanSurinameSwazilandSwedenSwitzerlandSyrian Arab RepublicTajikistanTanzaniaThailandTimor-LesteTogoTongaTrinidad and TobagoTunisiaTurkeyUgandaUkraineUnited Arab EmiratesUnited KingdomUnited StatesUpper middle incomeUruguayVanuatuVenezuela, RBVietnamWest Bank and GazaWorldYemen, Rep.ZambiaZimbabwe Linha do tempo:
Nesta escala de tempo está apresentado um gráfico de 1977 ano até 2016 ano Mauritius. Dados de 1976 ano ausente. O número de observações reais por data: 40.
Fonte (nome):
Indicadores de desenvolvimento mundial
Fonte (organização):
International Monetary Fund, International Financial Statistics and data files, and World Bank and OECD GDP estimates.
Categorias:
Financial Sector
Foi atualizado:
23 abr 2017 ano
Indicadores de alterações dos valores ao longo dos anos
Mínimo:
7.628
1 jan 2013 ano
Máximo:
32.691
1 jan 1984 ano
Na data de observação
Valor
Mudança absoluta
A alteração em relação ao valor anterior
1 jan 1977 ano
12.261
+12.261
0.0%
1 jan 1978 ano
18.796
+6.535
53.3%
1 jan 1979 ano
22.423
+3.626
19.29%
1 jan 1980 ano
23.643
+1.22
5.44%
1 jan 1981 ano
25.793
+2.15
9.09%
1 jan 1982 ano
26.619
+0.826
3.2%
1 jan 1983 ano
29.975
+3.356
12.61%
1 jan 1984 ano
32.691
+2.716
9.06%
1 jan 1985 ano
31.017
-1.674
-5.12%
1 jan 1986 ano
30.28
-0.738
-2.38%
1 jan 1987 ano
26.11
-4.17
-13.77%
1 jan 1988 ano
17.637
-8.473
-32.45%
1 jan 1989 ano
15.303
-2.333
-13.23%
1 jan 1990 ano
12.387
-2.917
-19.06%
1 jan 1991 ano
10.867
-1.52
-12.27%
1 jan 1992 ano
14.664
+3.797
34.94%
1 jan 1993 ano
14.631
-0.032
-0.22%
1 jan 1994 ano
15.366
+0.735
5.02%
1 jan 1995 ano
18.435
+3.069
19.97%
1 jan 1996 ano
18.708
+0.273
1.48%
1 jan 1997 ano
18.083
-0.625
-3.34%
1 jan 1998 ano
20.597
+2.514
13.9%
1 jan 1999 ano
17.875
-2.723
-13.22%
1 jan 2000 ano
16.358
-1.516
-8.48%
1 jan 2001 ano
11.263
-5.095
-31.15%
1 jan 2002 ano
14.64
+3.377
29.98%
1 jan 2003 ano
14.508
-0.132
-0.9%
1 jan 2004 ano
19.776
+5.268
36.31%
1 jan 2005 ano
24.313
+4.537
22.94%
1 jan 2006 ano
24.414
+0.101
0.42%
1 jan 2007 ano
20.721
-3.693
-15.13%
1 jan 2008 ano
17.838
-2.883
-13.91%
1 jan 2009 ano
16.523
-1.315
-7.37%
1 jan 2010 ano
10.348
-6.175
-37.37%
1 jan 2011 ano
9.691
-0.658
-6.36%
1 jan 2012 ano
9.126
-0.565
-5.83%
1 jan 2013 ano
7.628
-1.497
-16.41%
1 jan 2014 ano
9.334
+1.706
22.36%
1 jan 2015 ano
11.419
+2.086
22.34%
1 jan 2016 ano
10.251
-1.168
-10.23%
Classificação de países por estatísticas atuais por anos


Comentários: