29
/pt/
pt
AIzaSyAYiBZKx7MnpbEhh9jyipgxe19OcubqV5w
April 1, 2024
240260
Singapore
SGP
true
2
1
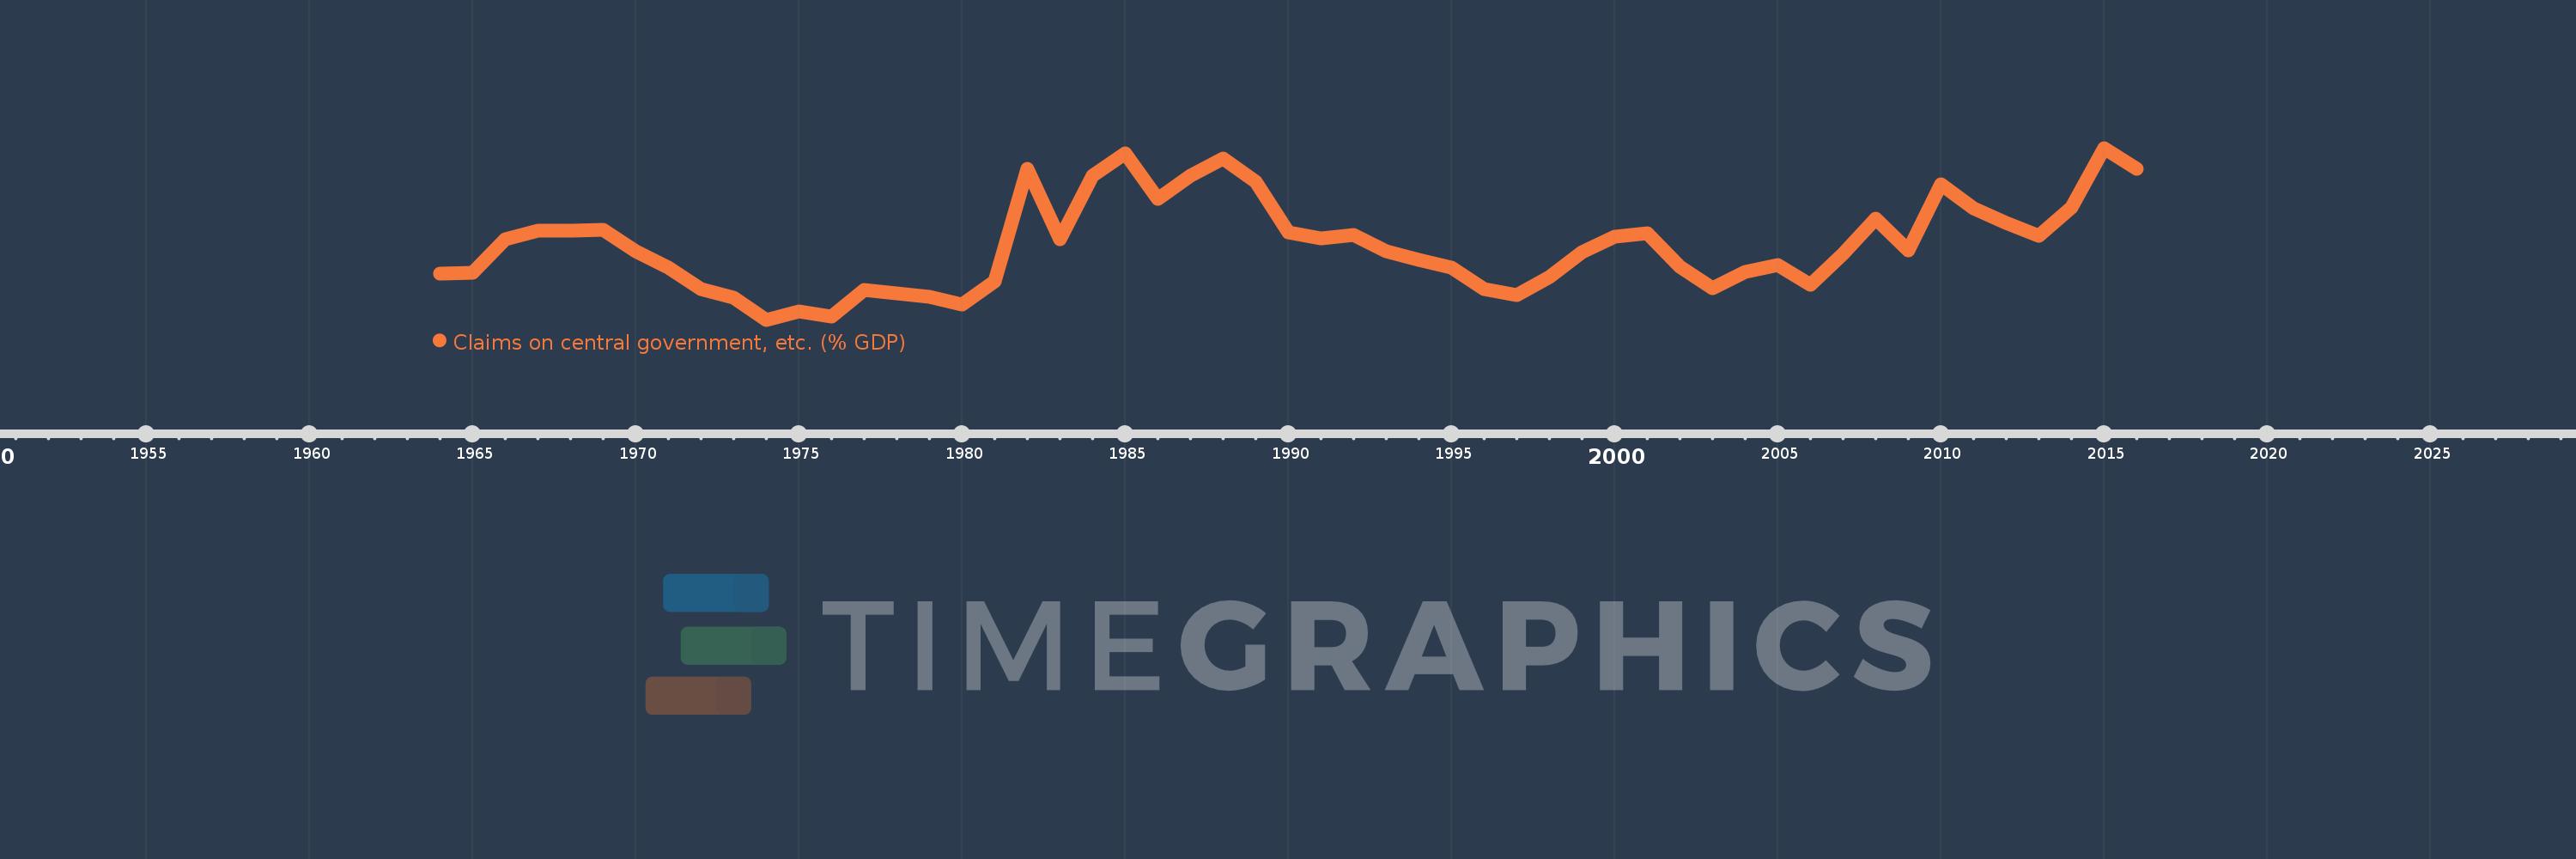
Claims on central government, etc. (% GDP)
2016,2015,2014,2013,2012,2011,2010,2009,2008,2007,2006,2005,2004,2003,2002,2001,2000,1999,1998,1997,1996,1995,1994,1993,1992,1991,1990,1989,1988,1987,1986,1985,1984,1983,1982,1981,1980,1979,1978,1977,1976,1975,1974,1973,1972,1971,1970,1969,1968,1967,1966,1965,1964
Estas estatísticas em outros países:
AfghanistanAlbaniaAlgeriaAngolaAntigua and BarbudaArab WorldArgentinaArmeniaArubaAustraliaAustriaAzerbaijanBahamas, TheBahrainBangladeshBarbadosBelarusBelgiumBelizeBeninBhutanBoliviaBosnia and HerzegovinaBotswanaBrazilBrunei DarussalamBulgariaBurkina FasoBurundiCabo VerdeCambodiaCameroonCanadaCaribbean small statesCentral African RepublicCentral Europe and the BalticsChadChileChinaColombiaComorosCongo, Dem. Rep.Congo, Rep.Costa RicaCote d'IvoireCroatiaCyprusCzech RepublicDenmarkDjiboutiDominicaDominican RepublicEarly-demographic dividendEast Asia & PacificEast Asia & Pacific (excluding high income)East Asia & Pacific (IDA & IBRD countries)EcuadorEgypt, Arab Rep.El SalvadorEquatorial GuineaEritreaEstoniaEthiopiaEuro areaEurope & Central AsiaEurope & Central Asia (excluding high income)Europe & Central Asia (IDA & IBRD countries)European UnionFijiFinlandFragile and conflict affected situationsFranceGabonGambia, TheGeorgiaGermanyGhanaGreeceGrenadaGuatemalaGuineaGuinea-BissauGuyanaHaitiHeavily indebted poor countries (HIPC)High incomeHondurasHong Kong SAR, ChinaHungaryIBRD onlyIcelandIDA & IBRD totalIDA blendIDA onlyIDA totalIndiaIndonesiaIran, Islamic Rep.IraqIrelandIsraelItalyJamaicaJapanJordanKazakhstanKenyaKorea, Rep.KosovoKuwaitKyrgyz RepublicLao PDRLate-demographic dividendLatin America & Caribbean Latin America & Caribbean (excluding high income)Latin America & the Caribbean (IDA & IBRD countries)LatviaLeast developed countries: UN classificationLebanonLesothoLiberiaLibyaLithuaniaLow & middle incomeLow incomeLower middle incomeLuxembourgMacao SAR, ChinaMacedonia, FYRMadagascarMalawiMalaysiaMaldivesMaliMaltaMauritaniaMauritiusMexicoMicronesia, Fed. Sts.Middle East & North AfricaMiddle East & North Africa (excluding high income)Middle East & North Africa (IDA & IBRD countries)Middle incomeMoldovaMongoliaMontenegroMoroccoMozambiqueMyanmarNamibiaNepalNetherlandsNew ZealandNicaraguaNigerNigeriaNorth AmericaNorwayOECD membersOmanOther small statesPacific island small statesPakistanPanamaPapua New GuineaParaguayPeruPhilippinesPolandPortugalPost-demographic dividendPre-demographic dividendQatarRomaniaRussian FederationRwandaSamoaSao Tome and PrincipeSaudi ArabiaSenegalSerbiaSeychellesSierra LeoneSingaporeSlovak RepublicSloveniaSmall statesSolomon IslandsSouth AfricaSouth AsiaSouth Asia (IDA & IBRD)South SudanSpainSri LankaSt. Kitts and NevisSt. LuciaSt. Vincent and the GrenadinesSub-Saharan Africa Sub-Saharan Africa (excluding high income)Sub-Saharan Africa (IDA & IBRD countries)SudanSurinameSwazilandSwedenSwitzerlandSyrian Arab RepublicTajikistanTanzaniaThailandTimor-LesteTogoTongaTrinidad and TobagoTunisiaTurkeyUgandaUkraineUnited Arab EmiratesUnited KingdomUnited StatesUpper middle incomeUruguayVanuatuVenezuela, RBVietnamWest Bank and GazaWorldYemen, Rep.ZambiaZimbabwe Linha do tempo:
Nesta escala de tempo está apresentado um gráfico de 1964 ano até 2016 ano Singapore. Dados de 1963 ano ausente. O número de observações reais por data: 53.
Fonte (nome):
Indicadores de desenvolvimento mundial
Fonte (organização):
International Monetary Fund, International Financial Statistics and data files, and World Bank and OECD GDP estimates.
Categorias:
Financial Sector
Foi atualizado:
23 abr 2017 ano
Indicadores de alterações dos valores ao longo dos anos
Mínimo:
-34.307
1 jan 1974 ano
Máximo:
-5.203
1 jan 2015 ano
Na data de observação
Valor
Mudança absoluta
A alteração em relação ao valor anterior
1 jan 1964 ano
-26.533
-26.533
0.0%
1 jan 1965 ano
-26.39
+0.143
-0.54%
1 jan 1966 ano
-20.723
+5.667
-21.47%
1 jan 1967 ano
-19.256
+1.467
-7.08%
1 jan 1968 ano
-19.219
+0.037
-0.19%
1 jan 1969 ano
-19.05
+0.169
-0.88%
1 jan 1970 ano
-22.762
-3.712
19.49%
1 jan 1971 ano
-25.545
-2.783
12.23%
1 jan 1972 ano
-29.165
-3.62
14.17%
1 jan 1973 ano
-30.551
-1.386
4.75%
1 jan 1974 ano
-34.307
-3.756
12.29%
1 jan 1975 ano
-32.934
+1.373
-4.0%
1 jan 1976 ano
-33.807
-0.873
2.65%
1 jan 1977 ano
-29.31
+4.497
-13.3%
1 jan 1978 ano
-29.815
-0.506
1.73%
1 jan 1979 ano
-30.386
-0.571
1.91%
1 jan 1980 ano
-31.718
-1.332
4.38%
1 jan 1981 ano
-27.73
+3.988
-12.57%
1 jan 1982 ano
-8.809
+18.922
-68.23%
1 jan 1983 ano
-20.715
-11.907
135.17%
1 jan 1984 ano
-9.969
+10.747
-51.88%
1 jan 1985 ano
-6.184
+3.784
-37.96%
1 jan 1986 ano
-13.874
-7.69
124.34%
1 jan 1987 ano
-9.845
+4.029
-29.04%
1 jan 1988 ano
-6.971
+2.874
-29.19%
1 jan 1989 ano
-10.915
-3.943
56.57%
1 jan 1990 ano
-19.572
-8.658
79.32%
1 jan 1991 ano
-20.548
-0.976
4.99%
1 jan 1992 ano
-19.96
+0.588
-2.86%
1 jan 1993 ano
-22.638
-2.678
13.42%
1 jan 1994 ano
-24.193
-1.555
6.87%
1 jan 1995 ano
-25.455
-1.262
5.22%
1 jan 1996 ano
-29.103
-3.648
14.33%
1 jan 1997 ano
-30.098
-0.995
3.42%
1 jan 1998 ano
-27.007
+3.091
-10.27%
1 jan 1999 ano
-22.848
+4.159
-15.4%
1 jan 2000 ano
-20.292
+2.556
-11.19%
1 jan 2001 ano
-19.643
+0.649
-3.2%
1 jan 2002 ano
-25.274
-5.631
28.67%
1 jan 2003 ano
-29.0
-3.726
14.74%
1 jan 2004 ano
-26.186
+2.814
-9.7%
1 jan 2005 ano
-24.998
+1.188
-4.54%
1 jan 2006 ano
-28.335
-3.337
13.35%
1 jan 2007 ano
-23.202
+5.133
-18.12%
1 jan 2008 ano
-17.208
+5.994
-25.84%
1 jan 2009 ano
-22.522
-5.314
30.88%
1 jan 2010 ano
-11.328
+11.194
-49.7%
1 jan 2011 ano
-15.465
-4.138
36.53%
1 jan 2012 ano
-17.915
-2.449
15.84%
1 jan 2013 ano
-20.111
-2.196
12.26%
1 jan 2014 ano
-15.321
+4.79
-23.82%
1 jan 2015 ano
-5.203
+10.118
-66.04%
1 jan 2016 ano
-8.698
-3.495
67.17%
Classificação de países por estatísticas atuais por anos


Comentários: