29
/pt/
pt
AIzaSyAYiBZKx7MnpbEhh9jyipgxe19OcubqV5w
April 1, 2024
210103
Nicaragua
NIC
true
2
1
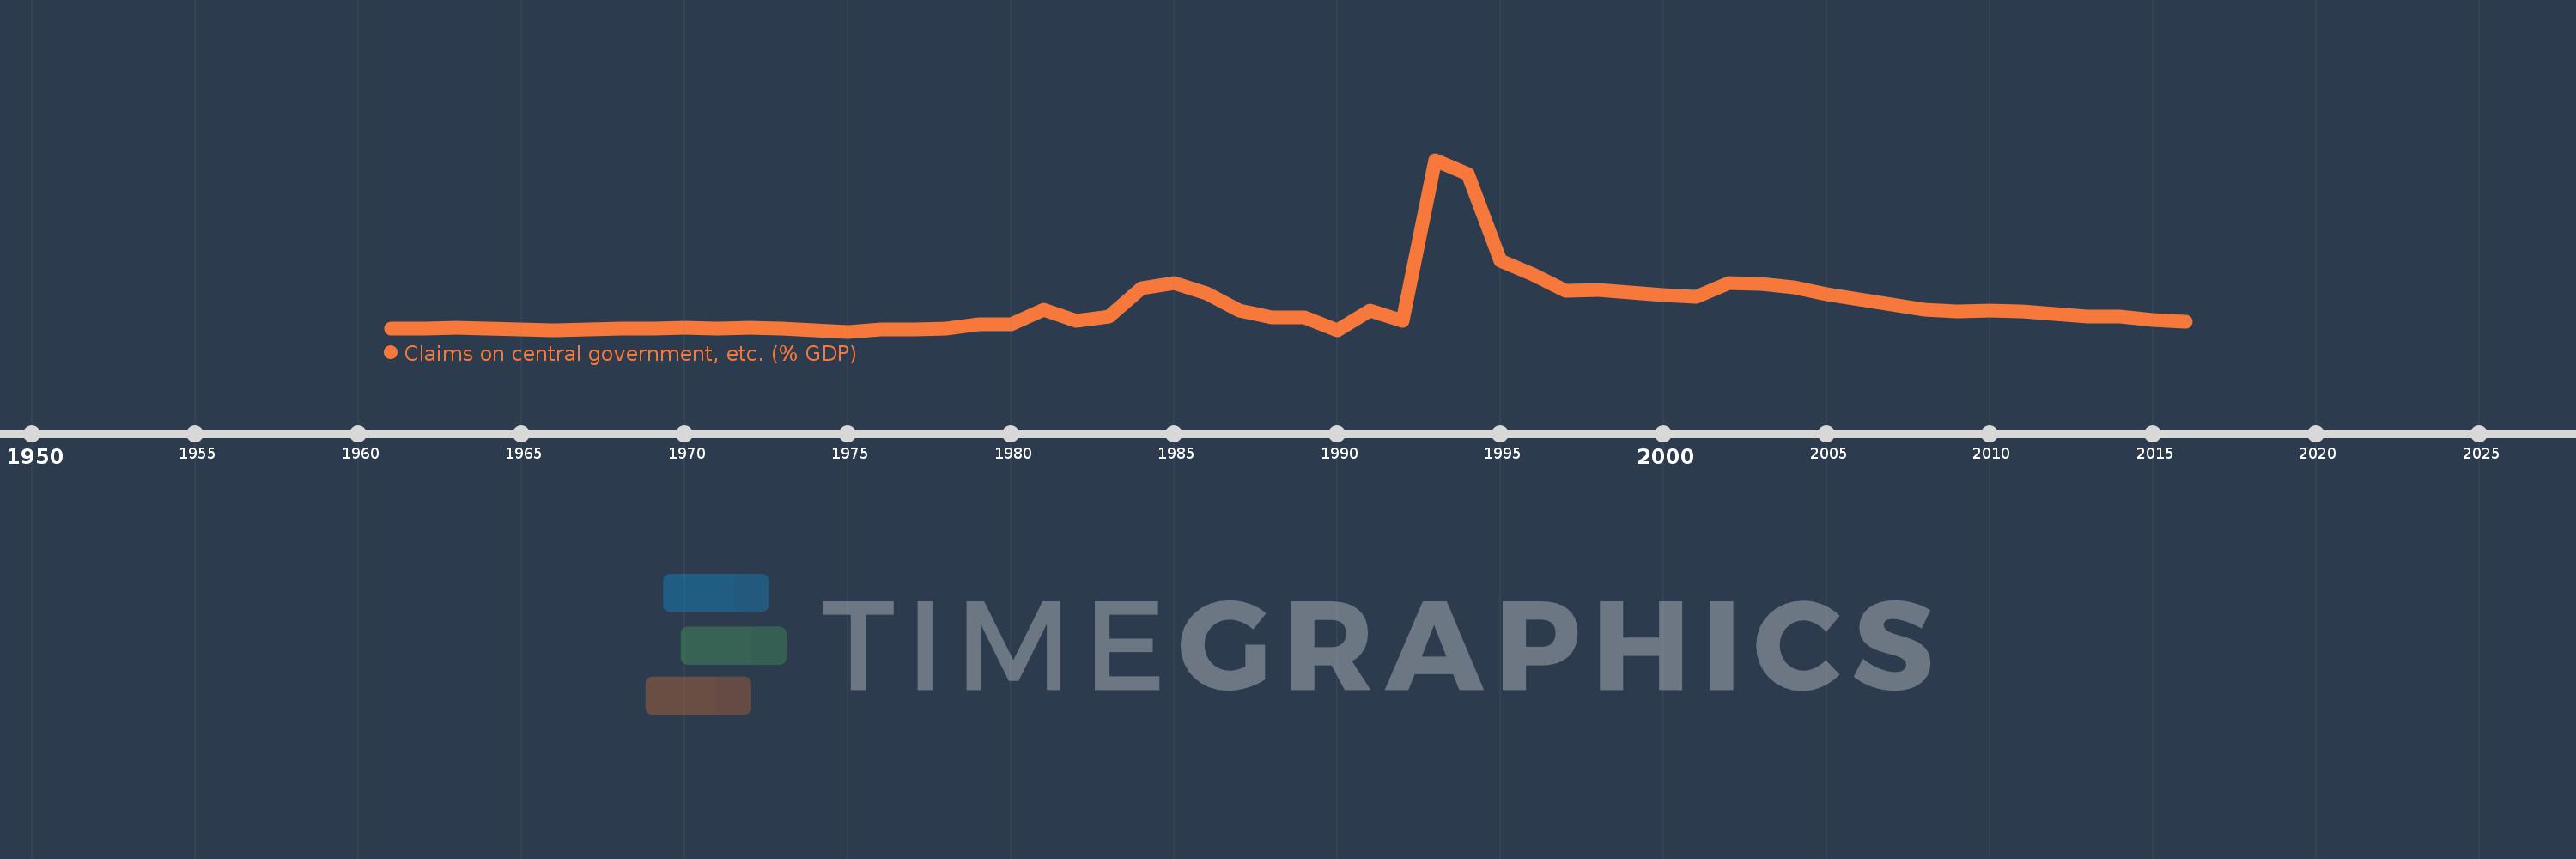
Claims on central government, etc. (% GDP)
2016,2015,2014,2013,2012,2011,2010,2009,2008,2007,2006,2005,2004,2003,2002,2001,2000,1999,1998,1997,1996,1995,1994,1993,1992,1991,1990,1989,1988,1987,1986,1985,1984,1983,1982,1981,1980,1979,1978,1977,1976,1975,1974,1973,1972,1971,1970,1969,1968,1967,1966,1965,1964,1963,1962,1961
Estas estatísticas em outros países:
AfghanistanAlbaniaAlgeriaAngolaAntigua and BarbudaArab WorldArgentinaArmeniaArubaAustraliaAustriaAzerbaijanBahamas, TheBahrainBangladeshBarbadosBelarusBelgiumBelizeBeninBhutanBoliviaBosnia and HerzegovinaBotswanaBrazilBrunei DarussalamBulgariaBurkina FasoBurundiCabo VerdeCambodiaCameroonCanadaCaribbean small statesCentral African RepublicCentral Europe and the BalticsChadChileChinaColombiaComorosCongo, Dem. Rep.Congo, Rep.Costa RicaCote d'IvoireCroatiaCyprusCzech RepublicDenmarkDjiboutiDominicaDominican RepublicEarly-demographic dividendEast Asia & PacificEast Asia & Pacific (excluding high income)East Asia & Pacific (IDA & IBRD countries)EcuadorEgypt, Arab Rep.El SalvadorEquatorial GuineaEritreaEstoniaEthiopiaEuro areaEurope & Central AsiaEurope & Central Asia (excluding high income)Europe & Central Asia (IDA & IBRD countries)European UnionFijiFinlandFragile and conflict affected situationsFranceGabonGambia, TheGeorgiaGermanyGhanaGreeceGrenadaGuatemalaGuineaGuinea-BissauGuyanaHaitiHeavily indebted poor countries (HIPC)High incomeHondurasHong Kong SAR, ChinaHungaryIBRD onlyIcelandIDA & IBRD totalIDA blendIDA onlyIDA totalIndiaIndonesiaIran, Islamic Rep.IraqIrelandIsraelItalyJamaicaJapanJordanKazakhstanKenyaKorea, Rep.KosovoKuwaitKyrgyz RepublicLao PDRLate-demographic dividendLatin America & Caribbean Latin America & Caribbean (excluding high income)Latin America & the Caribbean (IDA & IBRD countries)LatviaLeast developed countries: UN classificationLebanonLesothoLiberiaLibyaLithuaniaLow & middle incomeLow incomeLower middle incomeLuxembourgMacao SAR, ChinaMacedonia, FYRMadagascarMalawiMalaysiaMaldivesMaliMaltaMauritaniaMauritiusMexicoMicronesia, Fed. Sts.Middle East & North AfricaMiddle East & North Africa (excluding high income)Middle East & North Africa (IDA & IBRD countries)Middle incomeMoldovaMongoliaMontenegroMoroccoMozambiqueMyanmarNamibiaNepalNetherlandsNew ZealandNicaraguaNigerNigeriaNorth AmericaNorwayOECD membersOmanOther small statesPacific island small statesPakistanPanamaPapua New GuineaParaguayPeruPhilippinesPolandPortugalPost-demographic dividendPre-demographic dividendQatarRomaniaRussian FederationRwandaSamoaSao Tome and PrincipeSaudi ArabiaSenegalSerbiaSeychellesSierra LeoneSingaporeSlovak RepublicSloveniaSmall statesSolomon IslandsSouth AfricaSouth AsiaSouth Asia (IDA & IBRD)South SudanSpainSri LankaSt. Kitts and NevisSt. LuciaSt. Vincent and the GrenadinesSub-Saharan Africa Sub-Saharan Africa (excluding high income)Sub-Saharan Africa (IDA & IBRD countries)SudanSurinameSwazilandSwedenSwitzerlandSyrian Arab RepublicTajikistanTanzaniaThailandTimor-LesteTogoTongaTrinidad and TobagoTunisiaTurkeyUgandaUkraineUnited Arab EmiratesUnited KingdomUnited StatesUpper middle incomeUruguayVanuatuVenezuela, RBVietnamWest Bank and GazaWorldYemen, Rep.ZambiaZimbabwe Linha do tempo:
Nesta escala de tempo está apresentado um gráfico de 1961 ano até 2016 ano Nicaragua. Dados de 1960 ano ausente. O número de observações reais por data: 56.
Fonte (nome):
Indicadores de desenvolvimento mundial
Fonte (organização):
International Monetary Fund, International Financial Statistics and data files, and World Bank and OECD GDP estimates.
Categorias:
Financial Sector
Foi atualizado:
23 abr 2017 ano
Indicadores de alterações dos valores ao longo dos anos
Mínimo:
-2.119
1 jan 1975 ano
Máximo:
211.734
1 jan 1993 ano
Na data de observação
Valor
Mudança absoluta
A alteração em relação ao valor anterior
1 jan 1961 ano
1.447
+1.447
0.0%
1 jan 1962 ano
1.323
-0.124
-8.57%
1 jan 1963 ano
2.502
+1.18
89.2%
1 jan 1964 ano
1.596
-0.906
-36.2%
1 jan 1965 ano
0.696
-0.9
-56.39%
1 jan 1966 ano
-0.303
-0.999
-143.46%
1 jan 1967 ano
0.172
+0.474
-156.81%
1 jan 1968 ano
1.096
+0.924
537.36%
1 jan 1969 ano
1.472
+0.376
34.34%
1 jan 1970 ano
2.311
+0.839
57.01%
1 jan 1971 ano
2.047
-0.264
-11.41%
1 jan 1972 ano
2.169
+0.122
5.94%
1 jan 1973 ano
1.38
-0.789
-36.37%
1 jan 1974 ano
-0.421
-1.801
-130.48%
1 jan 1975 ano
-2.119
-1.698
403.77%
1 jan 1976 ano
0.413
+2.532
-119.5%
1 jan 1977 ano
0.921
+0.508
122.84%
1 jan 1978 ano
1.27
+0.349
37.91%
1 jan 1979 ano
6.73
+5.46
429.95%
1 jan 1980 ano
6.797
+0.067
1.0%
1 jan 1981 ano
25.203
+18.406
270.82%
1 jan 1982 ano
11.437
-13.766
-54.62%
1 jan 1983 ano
16.723
+5.285
46.21%
1 jan 1984 ano
52.325
+35.602
212.9%
1 jan 1985 ano
58.726
+6.4
12.23%
1 jan 1986 ano
44.964
-13.762
-23.43%
1 jan 1987 ano
24.105
-20.859
-46.39%
1 jan 1988 ano
15.284
-8.821
-36.59%
1 jan 1989 ano
15.913
+0.629
4.12%
1 jan 1990 ano
-0.527
-16.44
-103.31%
1 jan 1991 ano
23.693
+24.22
-4.6 mil%
1 jan 1992 ano
11.608
-12.085
-51.01%
1 jan 1993 ano
211.734
+200.125
1.72 mil%
1 jan 1994 ano
193.76
-17.974
-8.49%
1 jan 1995 ano
86.235
-107.525
-55.49%
1 jan 1996 ano
69.331
-16.904
-19.6%
1 jan 1997 ano
48.468
-20.863
-30.09%
1 jan 1998 ano
49.509
+1.041
2.15%
1 jan 1999 ano
46.039
-3.47
-7.01%
1 jan 2000 ano
42.956
-3.083
-6.7%
1 jan 2001 ano
40.765
-2.19
-5.1%
1 jan 2002 ano
58.167
+17.401
42.69%
1 jan 2003 ano
56.846
-1.321
-2.27%
1 jan 2004 ano
53.281
-3.565
-6.27%
1 jan 2005 ano
44.417
-8.864
-16.64%
1 jan 2006 ano
38.218
-6.198
-13.95%
1 jan 2007 ano
31.069
-7.149
-18.71%
1 jan 2008 ano
25.656
-5.413
-17.42%
1 jan 2009 ano
22.967
-2.689
-10.48%
1 jan 2010 ano
24.114
+1.147
4.99%
1 jan 2011 ano
23.087
-1.027
-4.26%
1 jan 2012 ano
19.743
-3.344
-14.48%
1 jan 2013 ano
17.117
-2.626
-13.3%
1 jan 2014 ano
16.378
-0.739
-4.32%
1 jan 2015 ano
12.637
-3.741
-22.84%
1 jan 2016 ano
10.651
-1.985
-15.71%
Classificação de países por estatísticas atuais por anos


Comentários: