29
/pt/
pt
AIzaSyAYiBZKx7MnpbEhh9jyipgxe19OcubqV5w
April 1, 2024
271812
Uganda
UGA
true
2
1
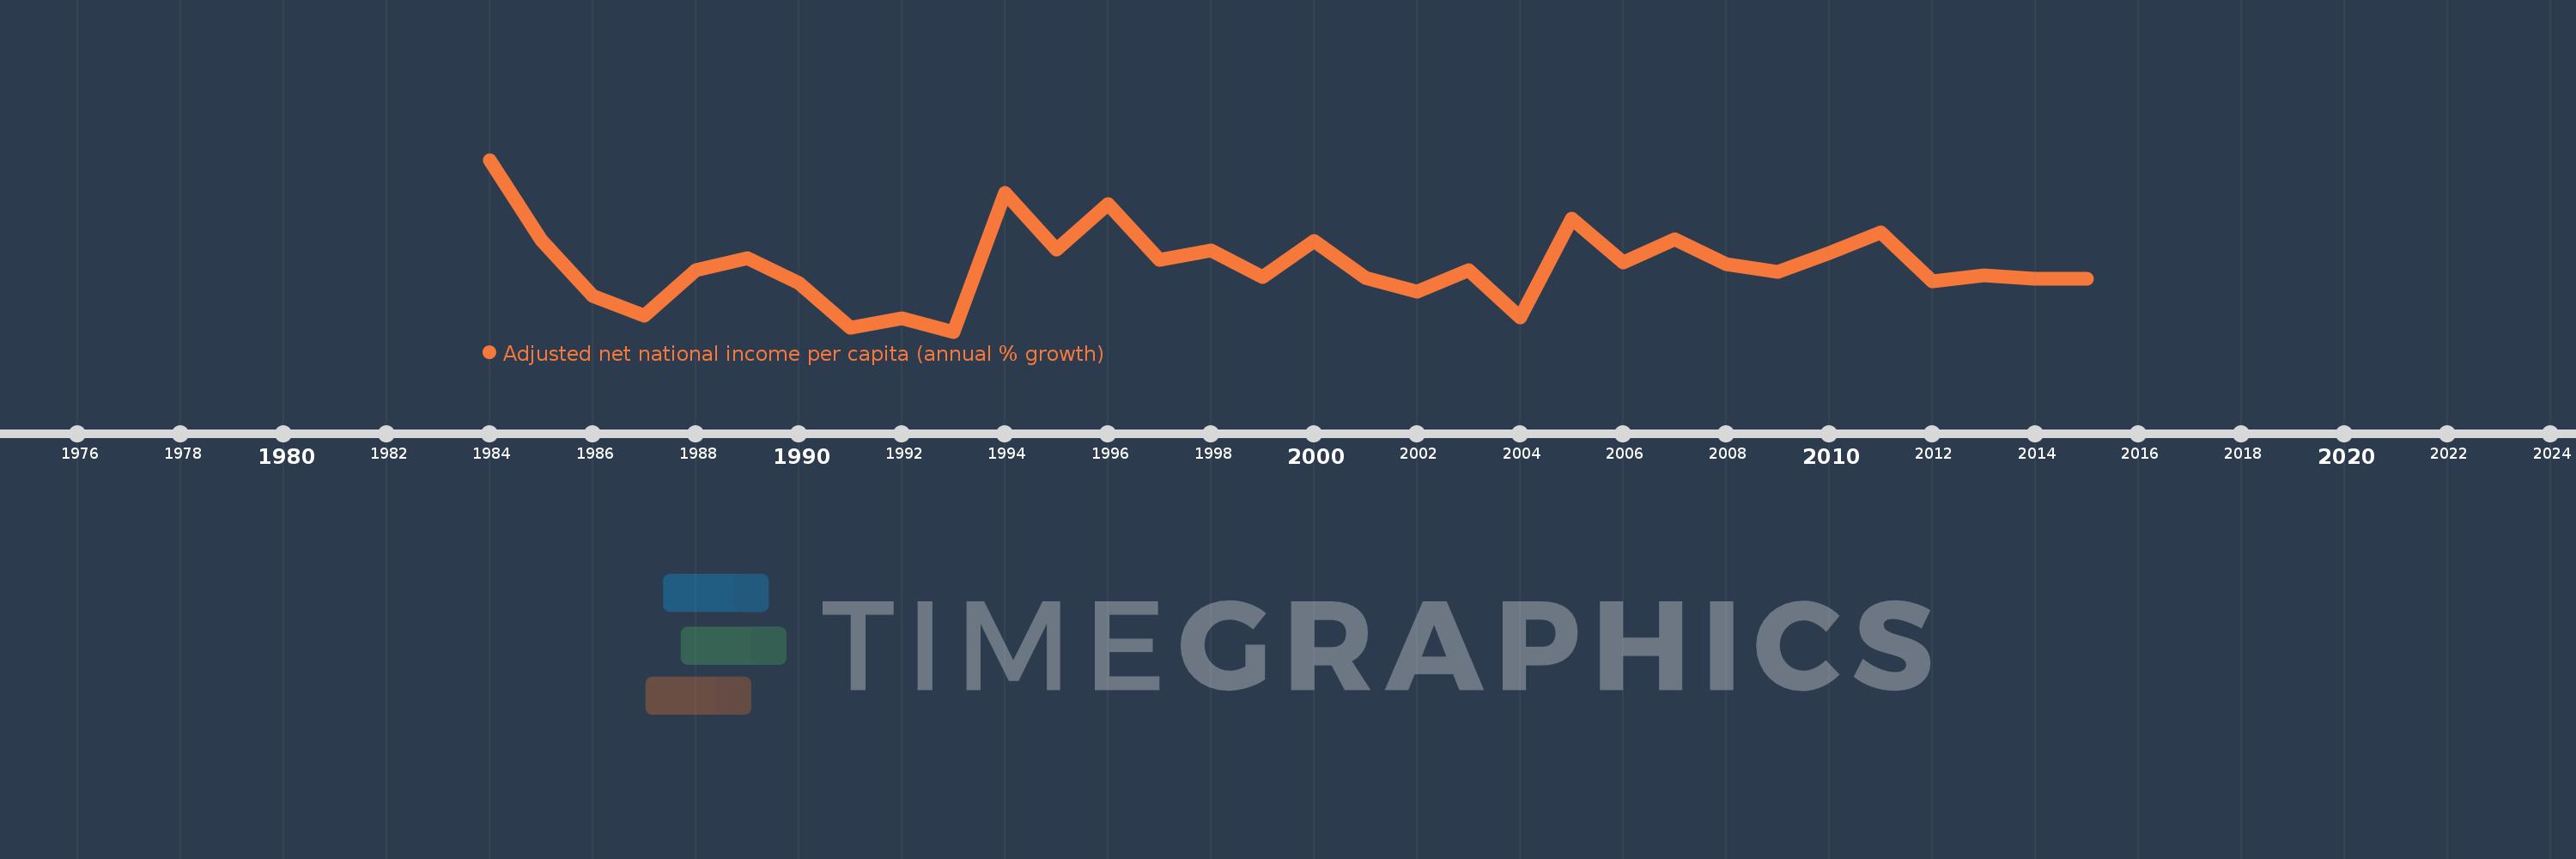
Adjusted net national income per capita (annual % growth)
2015,2014,2013,2012,2011,2010,2009,2008,2007,2006,2005,2004,2003,2002,2001,2000,1999,1998,1997,1996,1995,1994,1993,1992,1991,1990,1989,1988,1987,1986,1985,1984
Estas estatísticas em outros países:
Linha do tempo:
Nesta escala de tempo está apresentado um gráfico de 1984 ano até 2015 ano Uganda. Dados de 1983 ano ausente. O número de observações reais por data: 32.
Fonte (nome):
Indicadores de desenvolvimento mundial
Fonte (organização):
World Bank staff estimates based on sources and methods in World Bank's "The Changing Wealth of Nations: Measuring Sustainable Development in the New Millennium" (2011).
Categorias:
Economy & Growth
Foi atualizado:
23 abr 2017 ano
Indicadores de alterações dos valores ao longo dos anos
Mínimo:
-10.112
1 jan 1993 ano
Máximo:
24.582
1 jan 1984 ano
Na data de observação
Valor
Mudança absoluta
A alteração em relação ao valor anterior
1 jan 1984 ano
24.582
+24.582
0.0%
1 jan 1985 ano
8.43
-16.151
-65.71%
1 jan 1986 ano
-2.985
-11.415
-135.41%
1 jan 1987 ano
-6.942
-3.957
132.55%
1 jan 1988 ano
2.37
+9.312
-134.14%
1 jan 1989 ano
4.72
+2.35
99.16%
1 jan 1990 ano
-0.346
-5.067
-107.34%
1 jan 1991 ano
-9.37
-9.023
2.6 mil%
1 jan 1992 ano
-7.34
+2.029
-21.66%
1 jan 1993 ano
-10.112
-2.772
37.76%
1 jan 1994 ano
17.865
+27.977
-276.67%
1 jan 1995 ano
6.491
-11.375
-63.67%
1 jan 1996 ano
15.636
+9.146
140.91%
1 jan 1997 ano
4.408
-11.228
-71.81%
1 jan 1998 ano
6.242
+1.833
41.58%
1 jan 1999 ano
0.988
-5.253
-84.16%
1 jan 2000 ano
8.237
+7.249
733.36%
1 jan 2001 ano
0.665
-7.572
-91.92%
1 jan 2002 ano
-2.058
-2.723
-409.25%
1 jan 2003 ano
2.253
+4.311
-209.47%
1 jan 2004 ano
-7.291
-9.544
-423.62%
1 jan 2005 ano
12.633
+19.924
-273.27%
1 jan 2006 ano
3.84
-8.793
-69.61%
1 jan 2007 ano
8.483
+4.644
120.94%
1 jan 2008 ano
3.493
-4.99
-58.83%
1 jan 2009 ano
1.879
-1.614
-46.2%
1 jan 2010 ano
5.834
+3.954
210.43%
1 jan 2011 ano
9.849
+4.016
68.84%
1 jan 2012 ano
0.044
-9.805
-99.55%
1 jan 2013 ano
1.263
+1.219
2.75 mil%
1 jan 2014 ano
0.487
-0.776
-61.42%
1 jan 2015 ano
0.565
+0.078
15.94%
Classificação de países por estatísticas atuais por anos


Comentários: