29
/pt/
pt
AIzaSyAYiBZKx7MnpbEhh9jyipgxe19OcubqV5w
April 1, 2024
52368
OECD members
OED
false
2
1
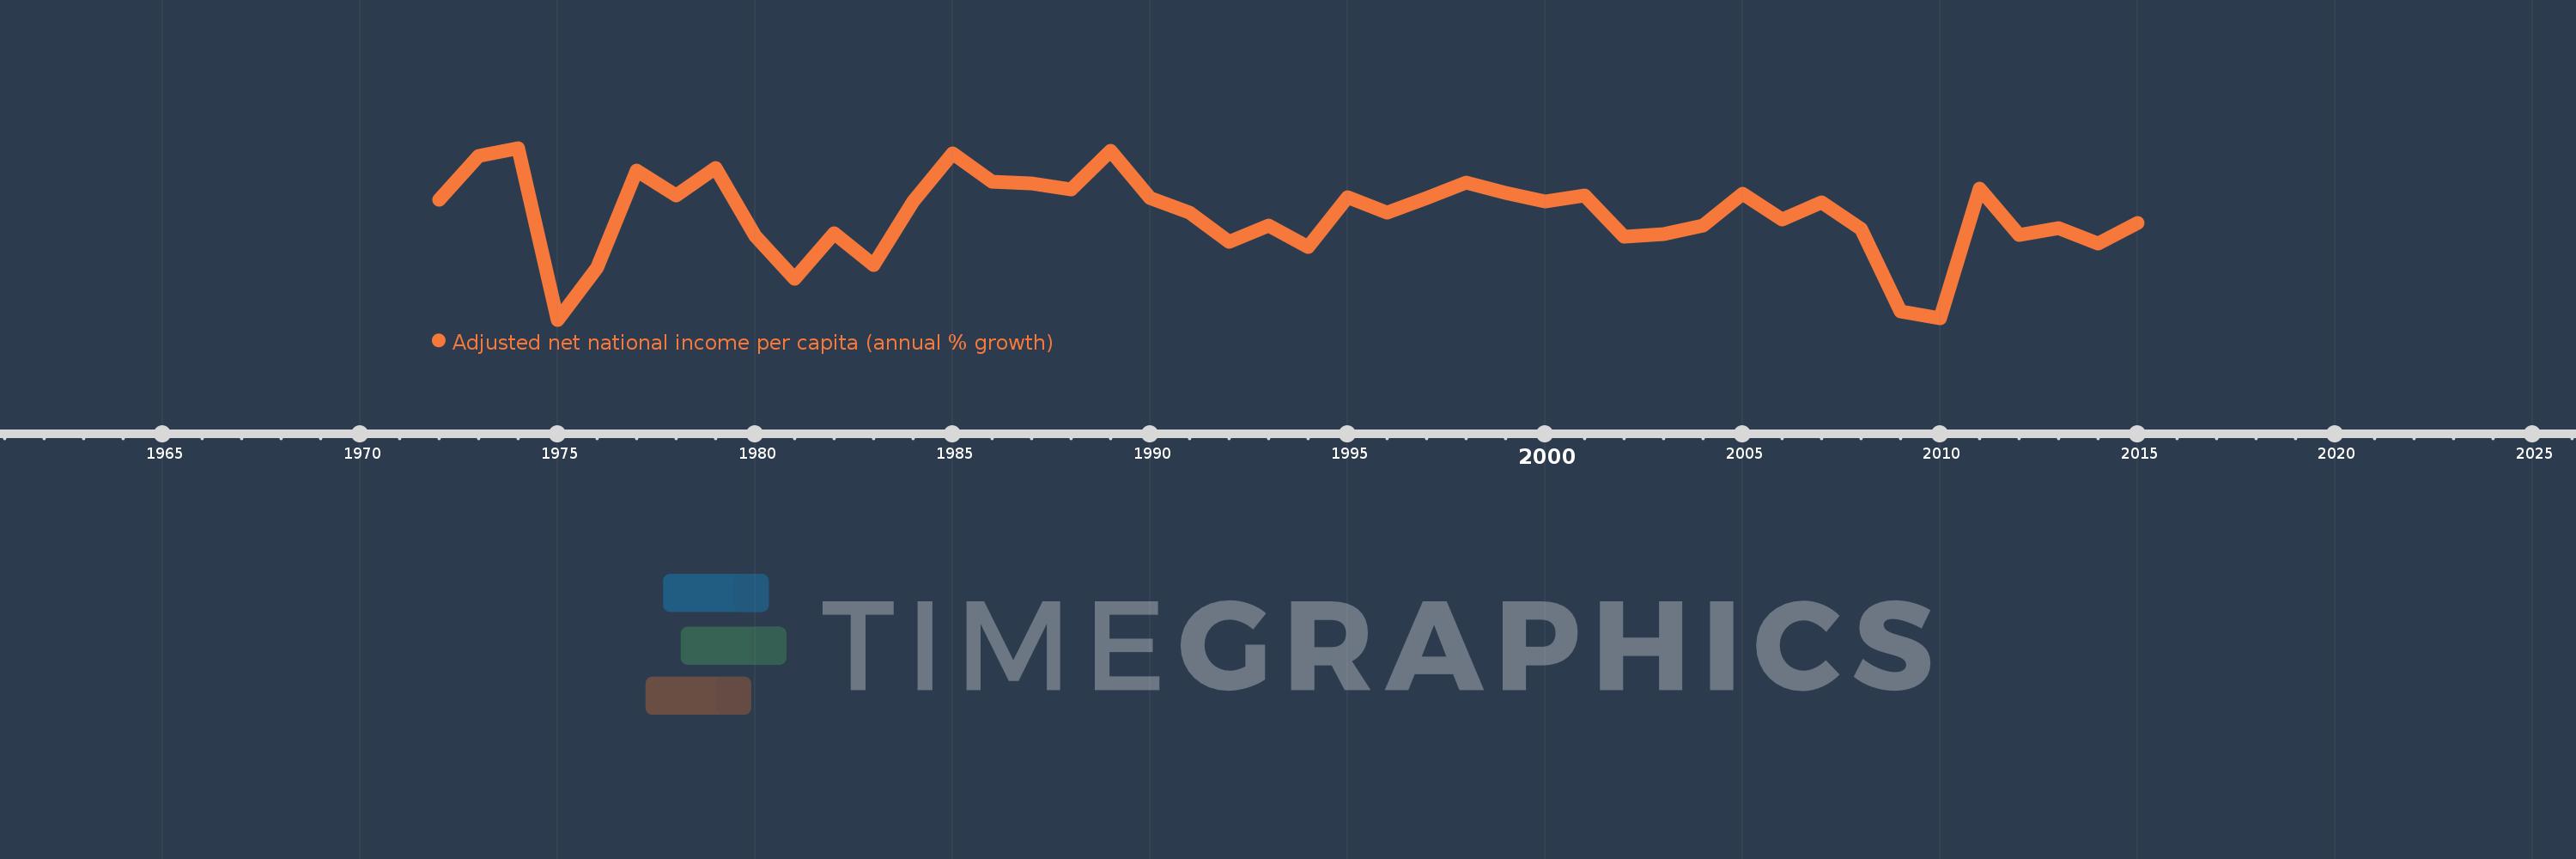
Adjusted net national income per capita (annual % growth)
2015,2014,2013,2012,2011,2010,2009,2008,2007,2006,2005,2004,2003,2002,2001,2000,1999,1998,1997,1996,1995,1994,1993,1992,1991,1990,1989,1988,1987,1986,1985,1984,1983,1982,1981,1980,1979,1978,1977,1976,1975,1974,1973,1972
Estas estatísticas em outros países:
Linha do tempo:
Nesta escala de tempo está apresentado um gráfico de 1972 ano até 2015 ano OECD members. Dados de 1971 ano ausente. O número de observações reais por data: 44.
Fonte (nome):
Indicadores de desenvolvimento mundial
Fonte (organização):
World Bank staff estimates based on sources and methods in World Bank's "The Changing Wealth of Nations: Measuring Sustainable Development in the New Millennium" (2011).
Categorias:
Economy & Growth
Foi atualizado:
23 abr 2017 ano
Indicadores de alterações dos valores ao longo dos anos
Mínimo:
-3.102
1 jan 1975 ano
Máximo:
4.798
1 jan 1974 ano
Na data de observação
Valor
Mudança absoluta
A alteração em relação ao valor anterior
1 jan 1972 ano
2.412
+2.412
0.0%
1 jan 1973 ano
4.441
+2.029
84.13%
1 jan 1974 ano
4.798
+0.357
8.04%
1 jan 1975 ano
-3.102
-7.9
-164.64%
1 jan 1976 ano
-0.719
+2.383
-76.83%
1 jan 1977 ano
3.758
+4.477
-622.99%
1 jan 1978 ano
2.603
-1.156
-30.75%
1 jan 1979 ano
3.862
+1.259
48.38%
1 jan 1980 ano
0.746
-3.116
-80.69%
1 jan 1981 ano
-1.223
-1.969
-264.02%
1 jan 1982 ano
0.886
+2.11
-172.46%
1 jan 1983 ano
-0.592
-1.479
-166.82%
1 jan 1984 ano
2.326
+2.918
-492.74%
1 jan 1985 ano
4.549
+2.223
95.56%
1 jan 1986 ano
3.24
-1.309
-28.78%
1 jan 1987 ano
3.184
-0.056
-1.72%
1 jan 1988 ano
2.889
-0.295
-9.27%
1 jan 1989 ano
4.65
+1.761
60.98%
1 jan 1990 ano
2.478
-2.172
-46.7%
1 jan 1991 ano
1.817
-0.661
-26.67%
1 jan 1992 ano
0.497
-1.321
-72.67%
1 jan 1993 ano
1.23
+0.734
147.71%
1 jan 1994 ano
0.25
-0.98
-79.65%
1 jan 1995 ano
2.515
+2.264
904.53%
1 jan 1996 ano
1.83
-0.685
-27.25%
1 jan 1997 ano
2.5
+0.67
36.64%
1 jan 1998 ano
3.188
+0.688
27.51%
1 jan 1999 ano
2.735
-0.453
-14.2%
1 jan 2000 ano
2.354
-0.381
-13.94%
1 jan 2001 ano
2.631
+0.277
11.79%
1 jan 2002 ano
0.708
-1.924
-73.1%
1 jan 2003 ano
0.839
+0.131
18.49%
1 jan 2004 ano
1.247
+0.408
48.64%
1 jan 2005 ano
2.702
+1.455
116.72%
1 jan 2006 ano
1.488
-1.214
-44.93%
1 jan 2007 ano
2.313
+0.825
55.44%
1 jan 2008 ano
1.083
-1.229
-53.15%
1 jan 2009 ano
-2.708
-3.792
-350.01%
1 jan 2010 ano
-3.052
-0.344
12.68%
1 jan 2011 ano
2.941
+5.993
-196.37%
1 jan 2012 ano
0.814
-2.127
-72.33%
1 jan 2013 ano
1.119
+0.305
37.47%
1 jan 2014 ano
0.414
-0.705
-63.04%
1 jan 2015 ano
1.367
+0.953
230.47%
Classificação de países por estatísticas atuais por anos


Comentários: