29
/pt/
pt
AIzaSyAYiBZKx7MnpbEhh9jyipgxe19OcubqV5w
April 1, 2024
106803
Colombia
COL
true
2
1
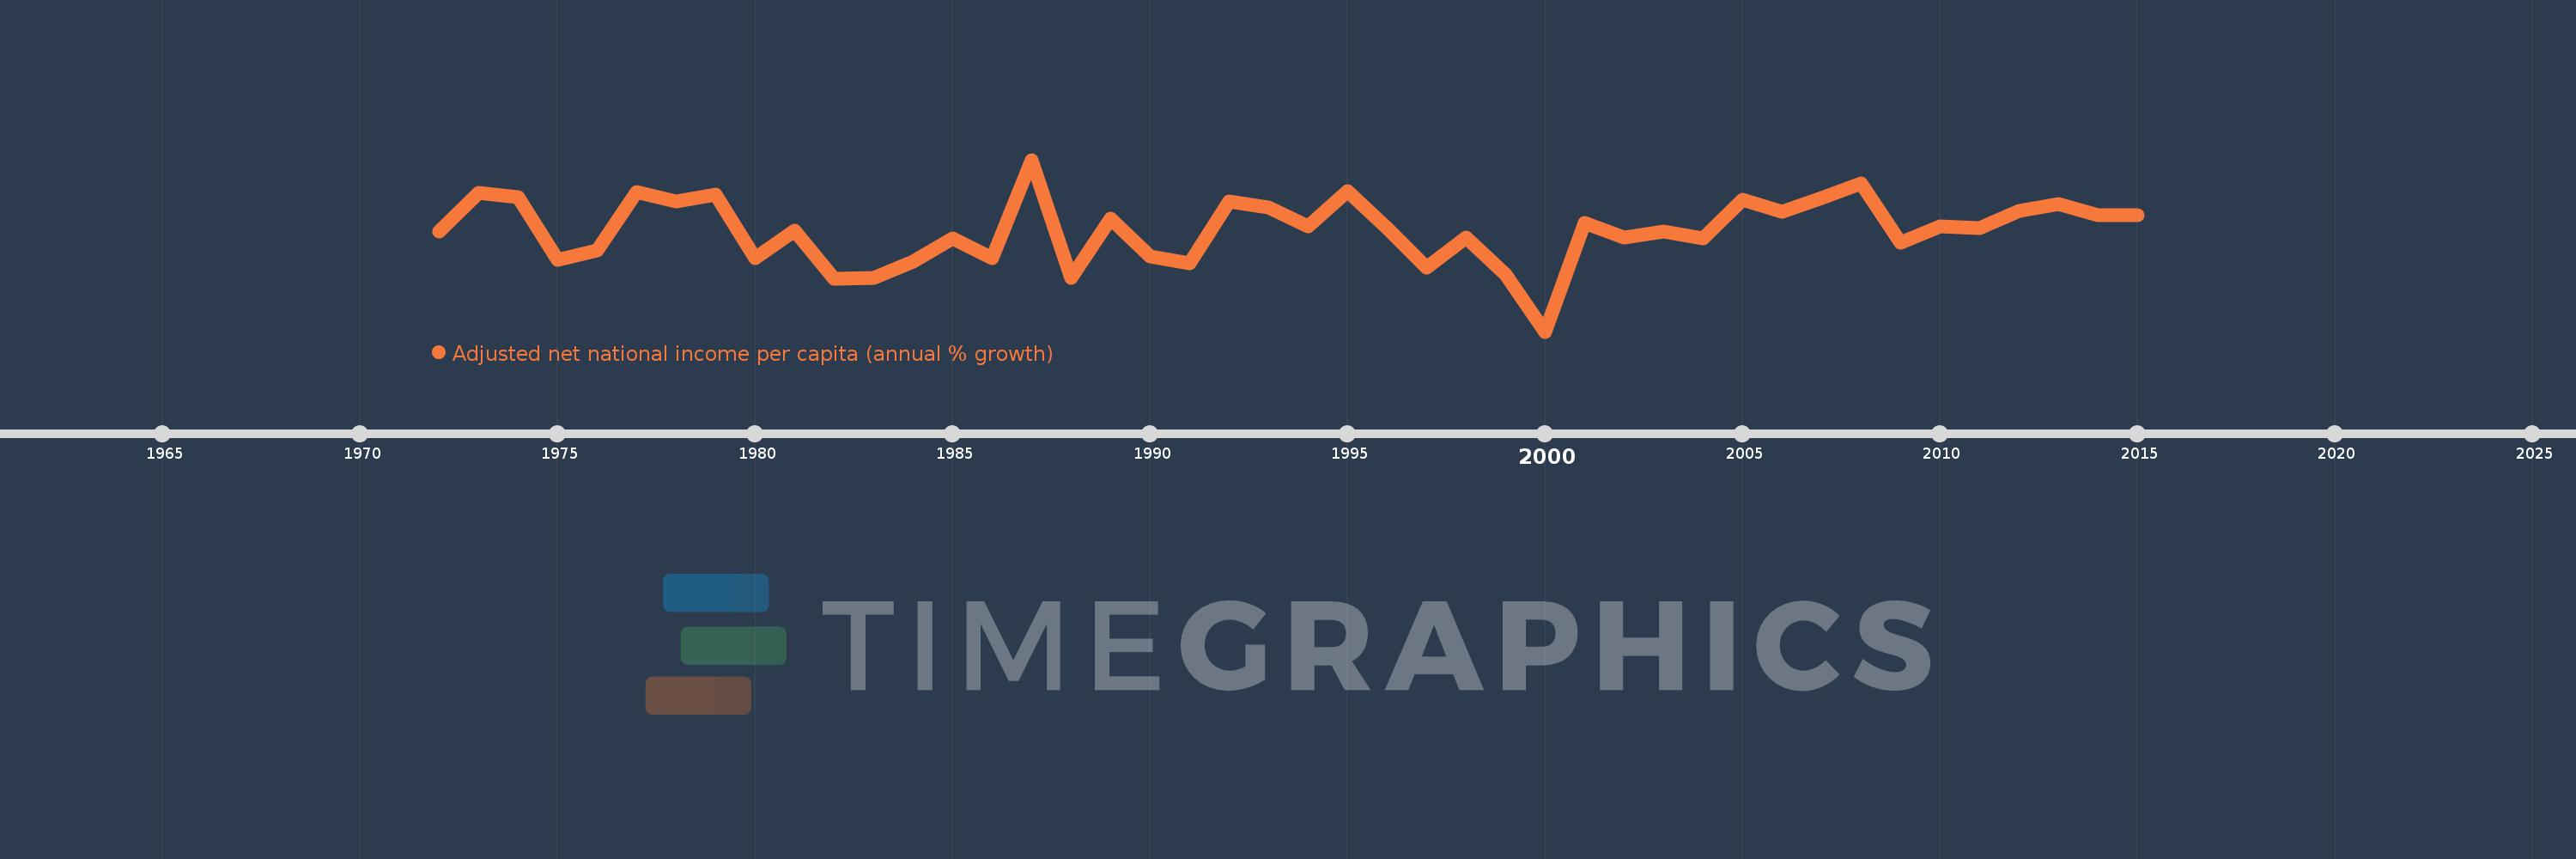
Adjusted net national income per capita (annual % growth)
2015,2014,2013,2012,2011,2010,2009,2008,2007,2006,2005,2004,2003,2002,2001,2000,1999,1998,1997,1996,1995,1994,1993,1992,1991,1990,1989,1988,1987,1986,1985,1984,1983,1982,1981,1980,1979,1978,1977,1976,1975,1974,1973,1972
Estas estatísticas em outros países:
Linha do tempo:
Nesta escala de tempo está apresentado um gráfico de 1972 ano até 2015 ano Colombia. Dados de 1971 ano ausente. O número de observações reais por data: 44.
Fonte (nome):
Indicadores de desenvolvimento mundial
Fonte (organização):
World Bank staff estimates based on sources and methods in World Bank's "The Changing Wealth of Nations: Measuring Sustainable Development in the New Millennium" (2011).
Categorias:
Economy & Growth
Foi atualizado:
23 abr 2017 ano
Indicadores de alterações dos valores ao longo dos anos
Mínimo:
-9.515
1 jan 2000 ano
Máximo:
10.439
1 jan 1987 ano
Na data de observação
Valor
Mudança absoluta
A alteração em relação ao valor anterior
1 jan 1972 ano
2.139
+2.139
0.0%
1 jan 1973 ano
6.609
+4.47
208.95%
1 jan 1974 ano
6.084
-0.525
-7.95%
1 jan 1975 ano
-1.147
-7.231
-118.85%
1 jan 1976 ano
-0.136
+1.011
-88.11%
1 jan 1977 ano
6.733
+6.87
-5.04 mil%
1 jan 1978 ano
5.63
-1.103
-16.38%
1 jan 1979 ano
6.438
+0.808
14.35%
1 jan 1980 ano
-0.963
-7.401
-114.95%
1 jan 1981 ano
2.247
+3.21
-333.42%
1 jan 1982 ano
-3.337
-5.584
-248.49%
1 jan 1983 ano
-3.315
+0.022
-0.66%
1 jan 1984 ano
-1.366
+1.949
-58.78%
1 jan 1985 ano
1.311
+2.678
-195.98%
1 jan 1986 ano
-0.97
-2.281
-173.94%
1 jan 1987 ano
10.439
+11.409
-1.18 mil%
1 jan 1988 ano
-3.263
-13.702
-131.26%
1 jan 1989 ano
3.607
+6.87
-210.56%
1 jan 1990 ano
-0.768
-4.375
-121.29%
1 jan 1991 ano
-1.593
-0.825
107.39%
1 jan 1992 ano
5.618
+7.211
-452.68%
1 jan 1993 ano
4.9
-0.718
-12.78%
1 jan 1994 ano
2.747
-2.153
-43.94%
1 jan 1995 ano
6.768
+4.021
146.36%
1 jan 1996 ano
2.504
-4.264
-63.0%
1 jan 1997 ano
-2.047
-4.551
-181.74%
1 jan 1998 ano
1.452
+3.499
-170.94%
1 jan 1999 ano
-2.873
-4.325
-297.87%
1 jan 2000 ano
-9.515
-6.642
231.19%
1 jan 2001 ano
3.077
+12.592
-132.34%
1 jan 2002 ano
1.364
-1.713
-55.68%
1 jan 2003 ano
2.153
+0.789
57.86%
1 jan 2004 ano
1.341
-0.812
-37.71%
1 jan 2005 ano
5.79
+4.449
331.65%
1 jan 2006 ano
4.427
-1.363
-23.54%
1 jan 2007 ano
5.975
+1.548
34.96%
1 jan 2008 ano
7.675
+1.7
28.45%
1 jan 2009 ano
0.803
-6.871
-89.53%
1 jan 2010 ano
2.67
+1.866
232.31%
1 jan 2011 ano
2.48
-0.19
-7.12%
1 jan 2012 ano
4.508
+2.028
81.8%
1 jan 2013 ano
5.264
+0.756
16.77%
1 jan 2014 ano
3.983
-1.281
-24.33%
1 jan 2015 ano
4.036
+0.053
1.34%
Classificação de países por estatísticas atuais por anos


Comentários: