29
/pt/
pt
AIzaSyAYiBZKx7MnpbEhh9jyipgxe19OcubqV5w
April 1, 2024
99478
Cameroon
CMR
true
2
1
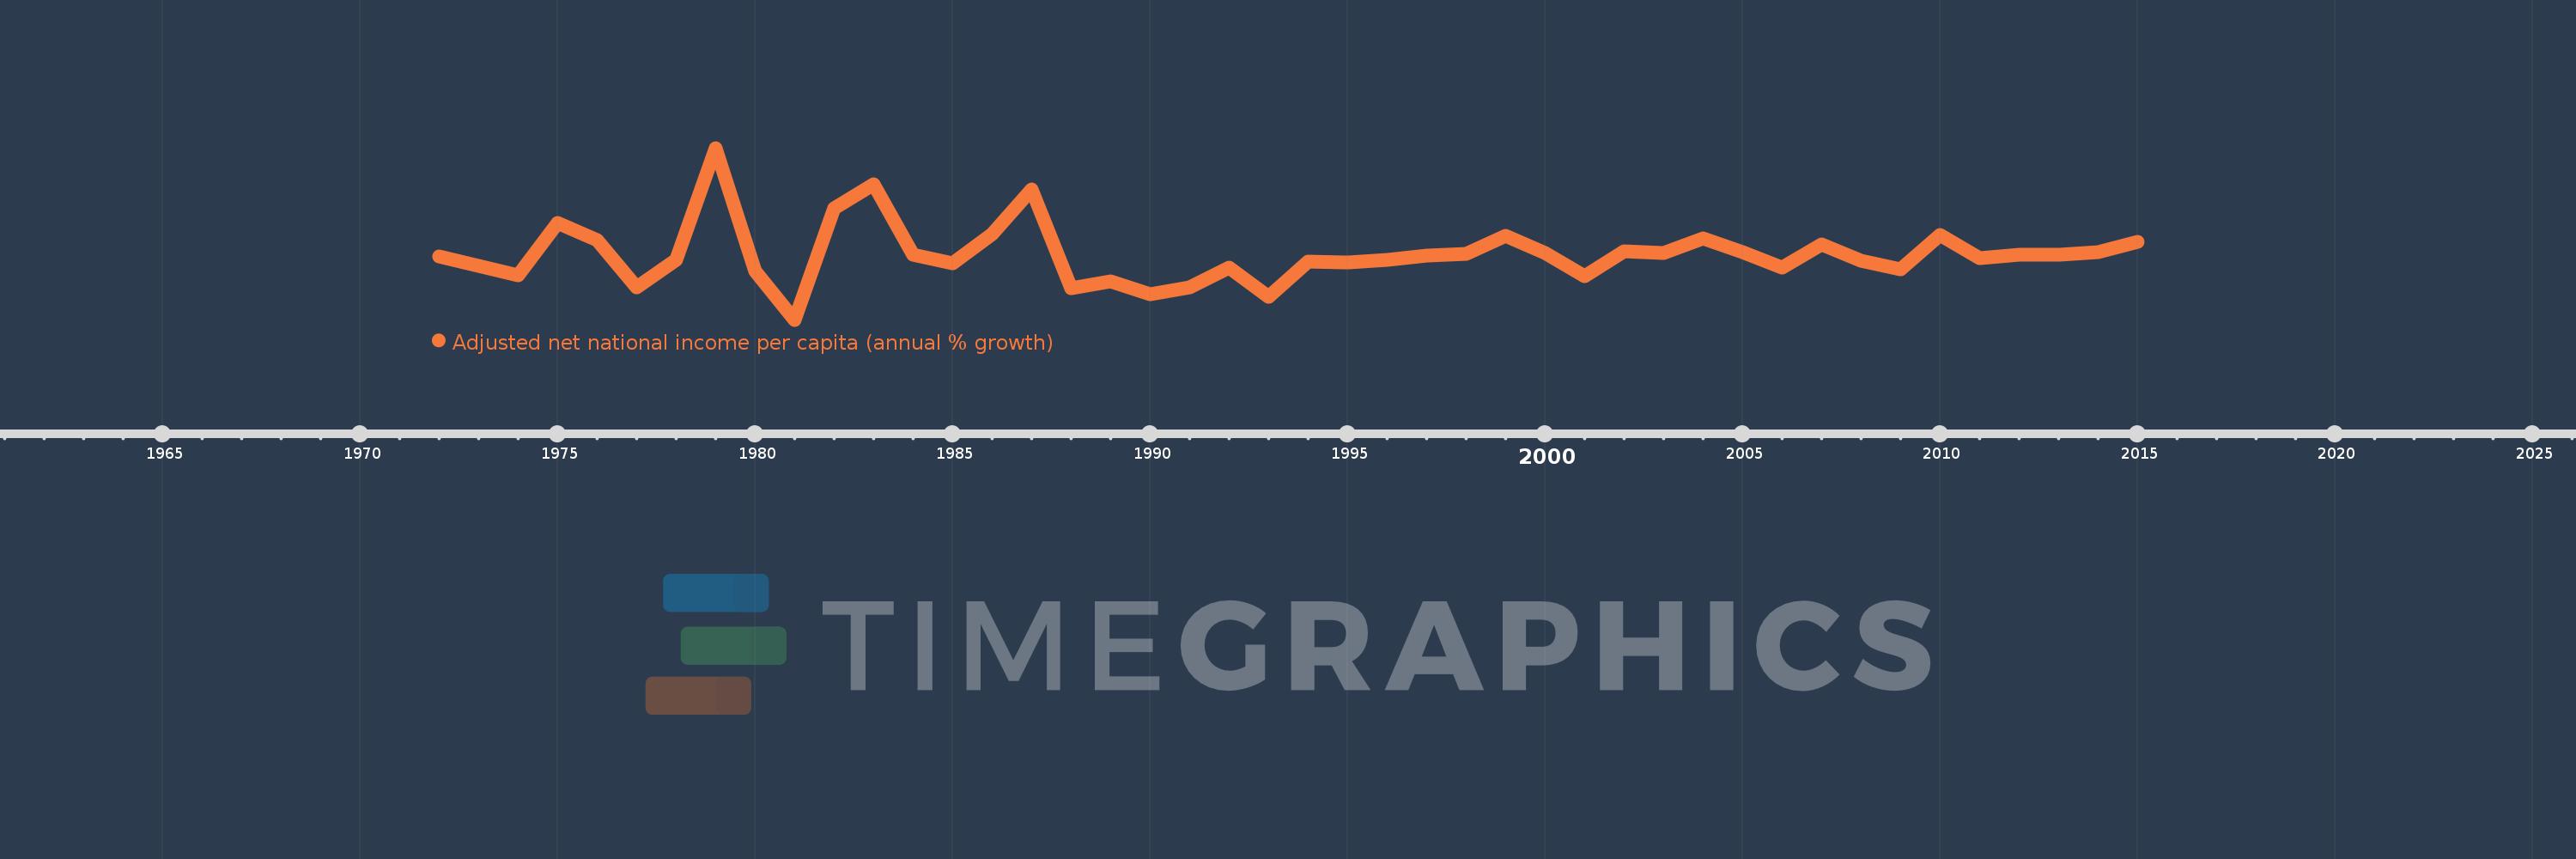
Adjusted net national income per capita (annual % growth)
2015,2014,2013,2012,2011,2010,2009,2008,2007,2006,2005,2004,2003,2002,2001,2000,1999,1998,1997,1996,1995,1994,1993,1992,1991,1990,1989,1988,1987,1986,1985,1984,1983,1982,1981,1980,1979,1978,1977,1976,1975,1974,1973,1972
Estas estatísticas em outros países:
Linha do tempo:
Nesta escala de tempo está apresentado um gráfico de 1972 ano até 2015 ano Cameroon. Dados de 1971 ano ausente. O número de observações reais por data: 44.
Fonte (nome):
Indicadores de desenvolvimento mundial
Fonte (organização):
World Bank staff estimates based on sources and methods in World Bank's "The Changing Wealth of Nations: Measuring Sustainable Development in the New Millennium" (2011).
Categorias:
Economy & Growth
Foi atualizado:
23 abr 2017 ano
Indicadores de alterações dos valores ao longo dos anos
Mínimo:
-21.44
1 jan 1981 ano
Máximo:
38.648
1 jan 1979 ano
Na data de observação
Valor
Mudança absoluta
A alteração em relação ao valor anterior
1 jan 1972 ano
0.646
+0.646
0.0%
1 jan 1973 ano
-2.637
-3.283
-508.45%
1 jan 1974 ano
-5.841
-3.204
121.49%
1 jan 1975 ano
12.397
+18.238
-312.23%
1 jan 1976 ano
6.554
-5.843
-47.14%
1 jan 1977 ano
-10.016
-16.57
-252.83%
1 jan 1978 ano
-0.58
+9.436
-94.21%
1 jan 1979 ano
38.648
+39.228
-6.76 mil%
1 jan 1980 ano
-4.375
-43.022
-111.32%
1 jan 1981 ano
-21.44
-17.066
390.11%
1 jan 1982 ano
17.61
+39.05
-182.13%
1 jan 1983 ano
25.906
+8.296
47.11%
1 jan 1984 ano
1.185
-24.721
-95.43%
1 jan 1985 ano
-1.767
-2.952
-249.09%
1 jan 1986 ano
8.439
+10.206
-577.69%
1 jan 1987 ano
24.227
+15.787
187.06%
1 jan 1988 ano
-10.346
-34.573
-142.7%
1 jan 1989 ano
-8.115
+2.231
-21.56%
1 jan 1990 ano
-12.389
-4.273
52.66%
1 jan 1991 ano
-10.099
+2.29
-18.48%
1 jan 1992 ano
-3.32
+6.779
-67.13%
1 jan 1993 ano
-13.496
-10.176
306.5%
1 jan 1994 ano
-1.202
+12.294
-91.09%
1 jan 1995 ano
-1.374
-0.172
14.35%
1 jan 1996 ano
-0.37
+1.005
-73.1%
1 jan 1997 ano
1.152
+1.522
-411.62%
1 jan 1998 ano
1.701
+0.549
47.61%
1 jan 1999 ano
7.774
+6.074
357.11%
1 jan 2000 ano
1.982
-5.793
-74.51%
1 jan 2001 ano
-6.143
-8.125
-409.99%
1 jan 2002 ano
2.552
+8.695
-141.54%
1 jan 2003 ano
2.018
-0.534
-20.91%
1 jan 2004 ano
7.086
+5.068
251.11%
1 jan 2005 ano
2.245
-4.841
-68.32%
1 jan 2006 ano
-3.148
-5.393
-240.24%
1 jan 2007 ano
4.947
+8.095
-257.16%
1 jan 2008 ano
-0.772
-5.719
-115.6%
1 jan 2009 ano
-3.837
-3.065
397.06%
1 jan 2010 ano
8.128
+11.965
-311.8%
1 jan 2011 ano
0.197
-7.931
-97.57%
1 jan 2012 ano
1.229
+1.032
523.17%
1 jan 2013 ano
1.261
+0.032
2.64%
1 jan 2014 ano
2.311
+1.05
83.24%
1 jan 2015 ano
5.816
+3.505
151.64%
Classificação de países por estatísticas atuais por anos


Comentários: