29
/pt/
pt
AIzaSyAYiBZKx7MnpbEhh9jyipgxe19OcubqV5w
April 1, 2024
121692
Dominican Republic
DOM
true
2
1
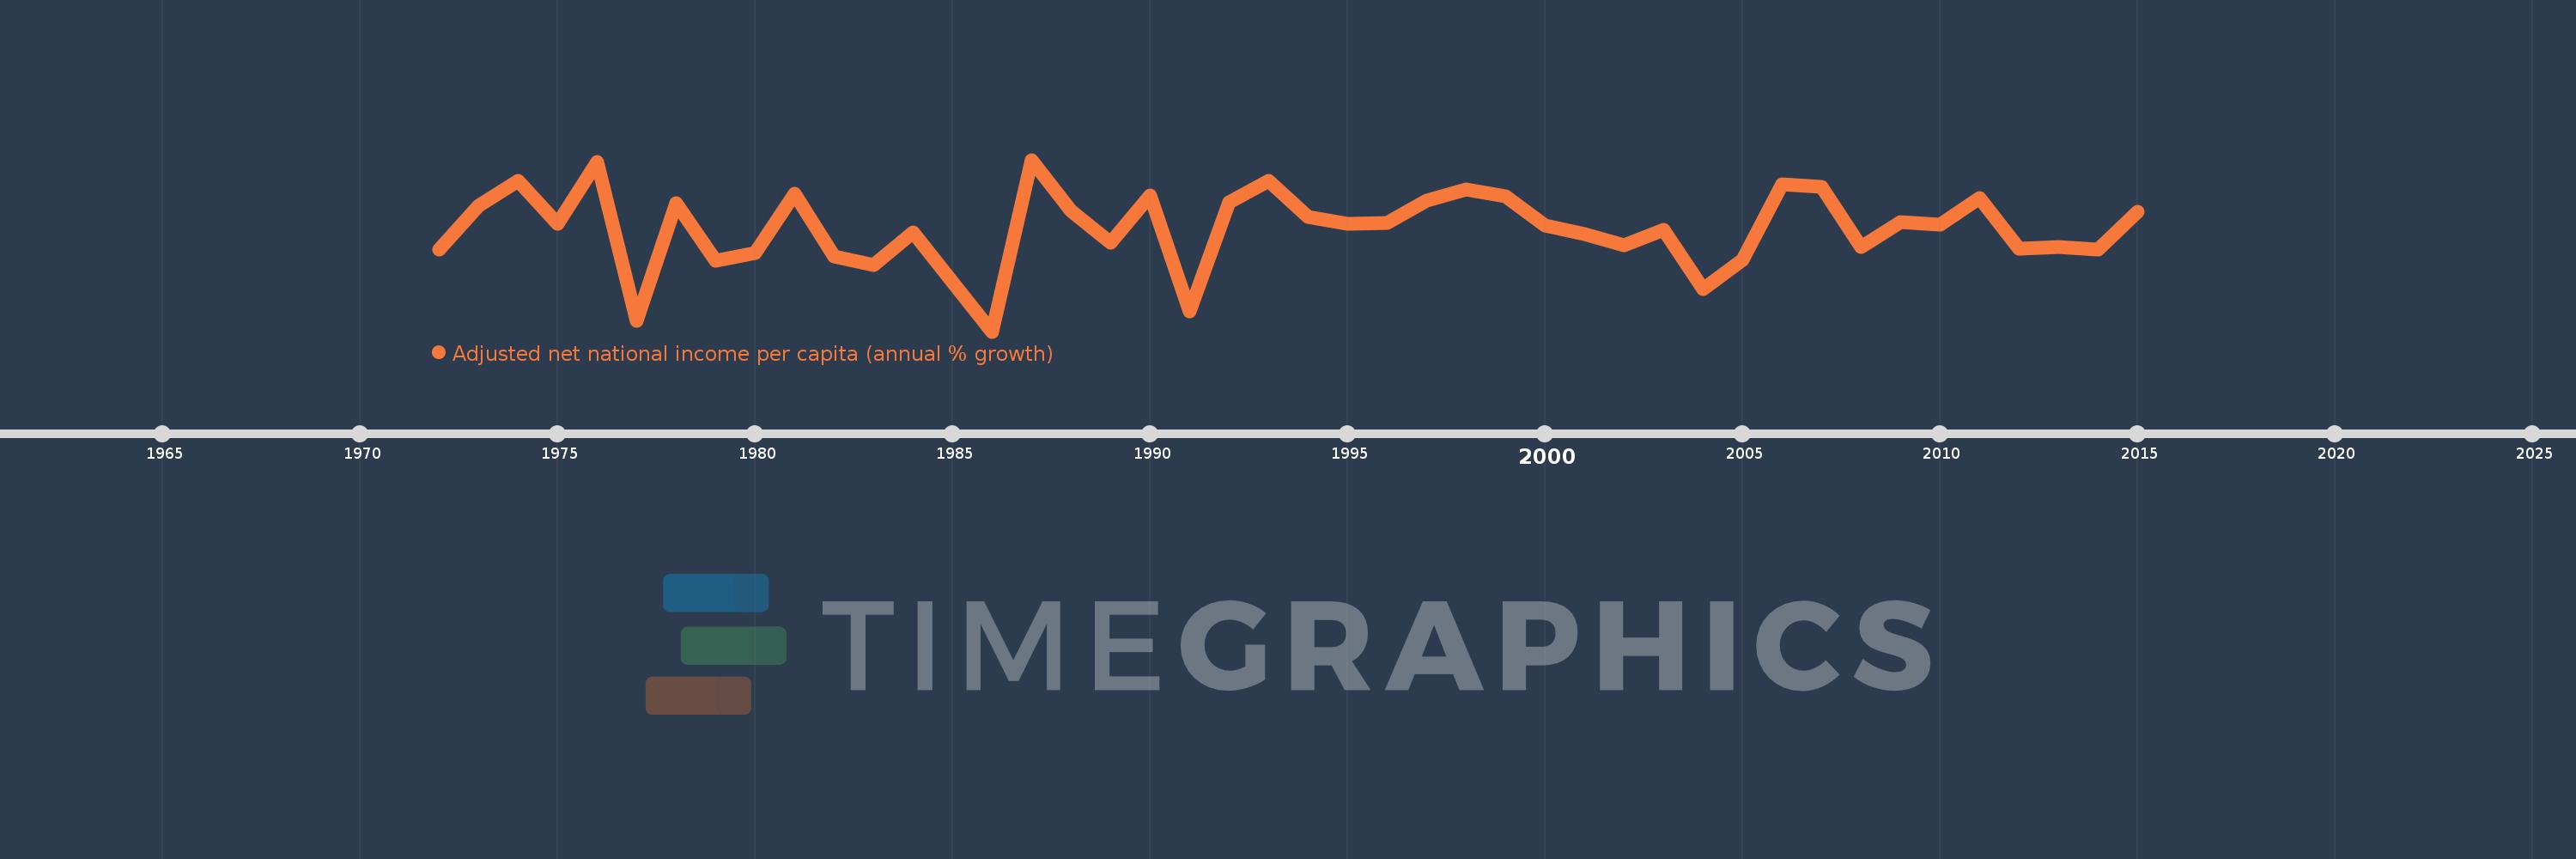
Adjusted net national income per capita (annual % growth)
2015,2014,2013,2012,2011,2010,2009,2008,2007,2006,2005,2004,2003,2002,2001,2000,1999,1998,1997,1996,1995,1994,1993,1992,1991,1990,1989,1988,1987,1986,1985,1984,1983,1982,1981,1980,1979,1978,1977,1976,1975,1974,1973,1972
Estas estatísticas em outros países:
Linha do tempo:
Nesta escala de tempo está apresentado um gráfico de 1972 ano até 2015 ano Dominican Republic. Dados de 1971 ano ausente. O número de observações reais por data: 44.
Fonte (nome):
Indicadores de desenvolvimento mundial
Fonte (organização):
World Bank staff estimates based on sources and methods in World Bank's "The Changing Wealth of Nations: Measuring Sustainable Development in the New Millennium" (2011).
Categorias:
Economy & Growth
Foi atualizado:
23 abr 2017 ano
Indicadores de alterações dos valores ao longo dos anos
Mínimo:
-10.453
1 jan 1986 ano
Máximo:
11.532
1 jan 1987 ano
Na data de observação
Valor
Mudança absoluta
A alteração em relação ao valor anterior
1 jan 1972 ano
0.087
+0.087
0.0%
1 jan 1973 ano
5.664
+5.577
6.41 mil%
1 jan 1974 ano
8.847
+3.183
56.2%
1 jan 1975 ano
3.29
-5.557
-62.81%
1 jan 1976 ano
11.308
+8.017
243.65%
1 jan 1977 ano
-9.024
-20.332
-179.8%
1 jan 1978 ano
5.97
+14.994
-166.16%
1 jan 1979 ano
-1.353
-7.323
-122.67%
1 jan 1980 ano
-0.366
+0.987
-72.97%
1 jan 1981 ano
7.222
+7.588
-2.07 mil%
1 jan 1982 ano
-0.852
-8.075
-111.8%
1 jan 1983 ano
-1.918
-1.066
125.04%
1 jan 1984 ano
2.274
+4.192
-218.57%
1 jan 1985 ano
-4.083
-6.357
-279.53%
1 jan 1986 ano
-10.453
-6.37
156.03%
1 jan 1987 ano
11.532
+21.985
-210.32%
1 jan 1988 ano
4.939
-6.593
-57.17%
1 jan 1989 ano
0.935
-4.004
-81.07%
1 jan 1990 ano
6.946
+6.012
643.16%
1 jan 1991 ano
-7.91
-14.856
-213.87%
1 jan 1992 ano
6.061
+13.971
-176.63%
1 jan 1993 ano
8.892
+2.831
46.7%
1 jan 1994 ano
4.249
-4.643
-52.21%
1 jan 1995 ano
3.315
-0.934
-21.99%
1 jan 1996 ano
3.398
+0.083
2.52%
1 jan 1997 ano
6.283
+2.884
84.87%
1 jan 1998 ano
7.733
+1.45
23.08%
1 jan 1999 ano
6.862
-0.87
-11.26%
1 jan 2000 ano
3.151
-3.712
-54.08%
1 jan 2001 ano
2.071
-1.08
-34.26%
1 jan 2002 ano
0.566
-1.505
-72.65%
1 jan 2003 ano
2.561
+1.994
352.04%
1 jan 2004 ano
-5.023
-7.583
-296.15%
1 jan 2005 ano
-1.224
+3.799
-75.63%
1 jan 2006 ano
8.441
+9.665
-789.54%
1 jan 2007 ano
8.1
-0.341
-4.04%
1 jan 2008 ano
0.422
-7.678
-94.79%
1 jan 2009 ano
3.512
+3.09
732.86%
1 jan 2010 ano
3.211
-0.301
-8.57%
1 jan 2011 ano
6.633
+3.422
106.59%
1 jan 2012 ano
0.183
-6.45
-97.24%
1 jan 2013 ano
0.332
+0.149
81.3%
1 jan 2014 ano
0.008
-0.325
-97.71%
1 jan 2015 ano
4.895
+4.888
64.28 mil%
Classificação de países por estatísticas atuais por anos


Comentários: