29
/pt/
pt
AIzaSyAYiBZKx7MnpbEhh9jyipgxe19OcubqV5w
April 1, 2024
163459
Japan
JPN
true
2
1
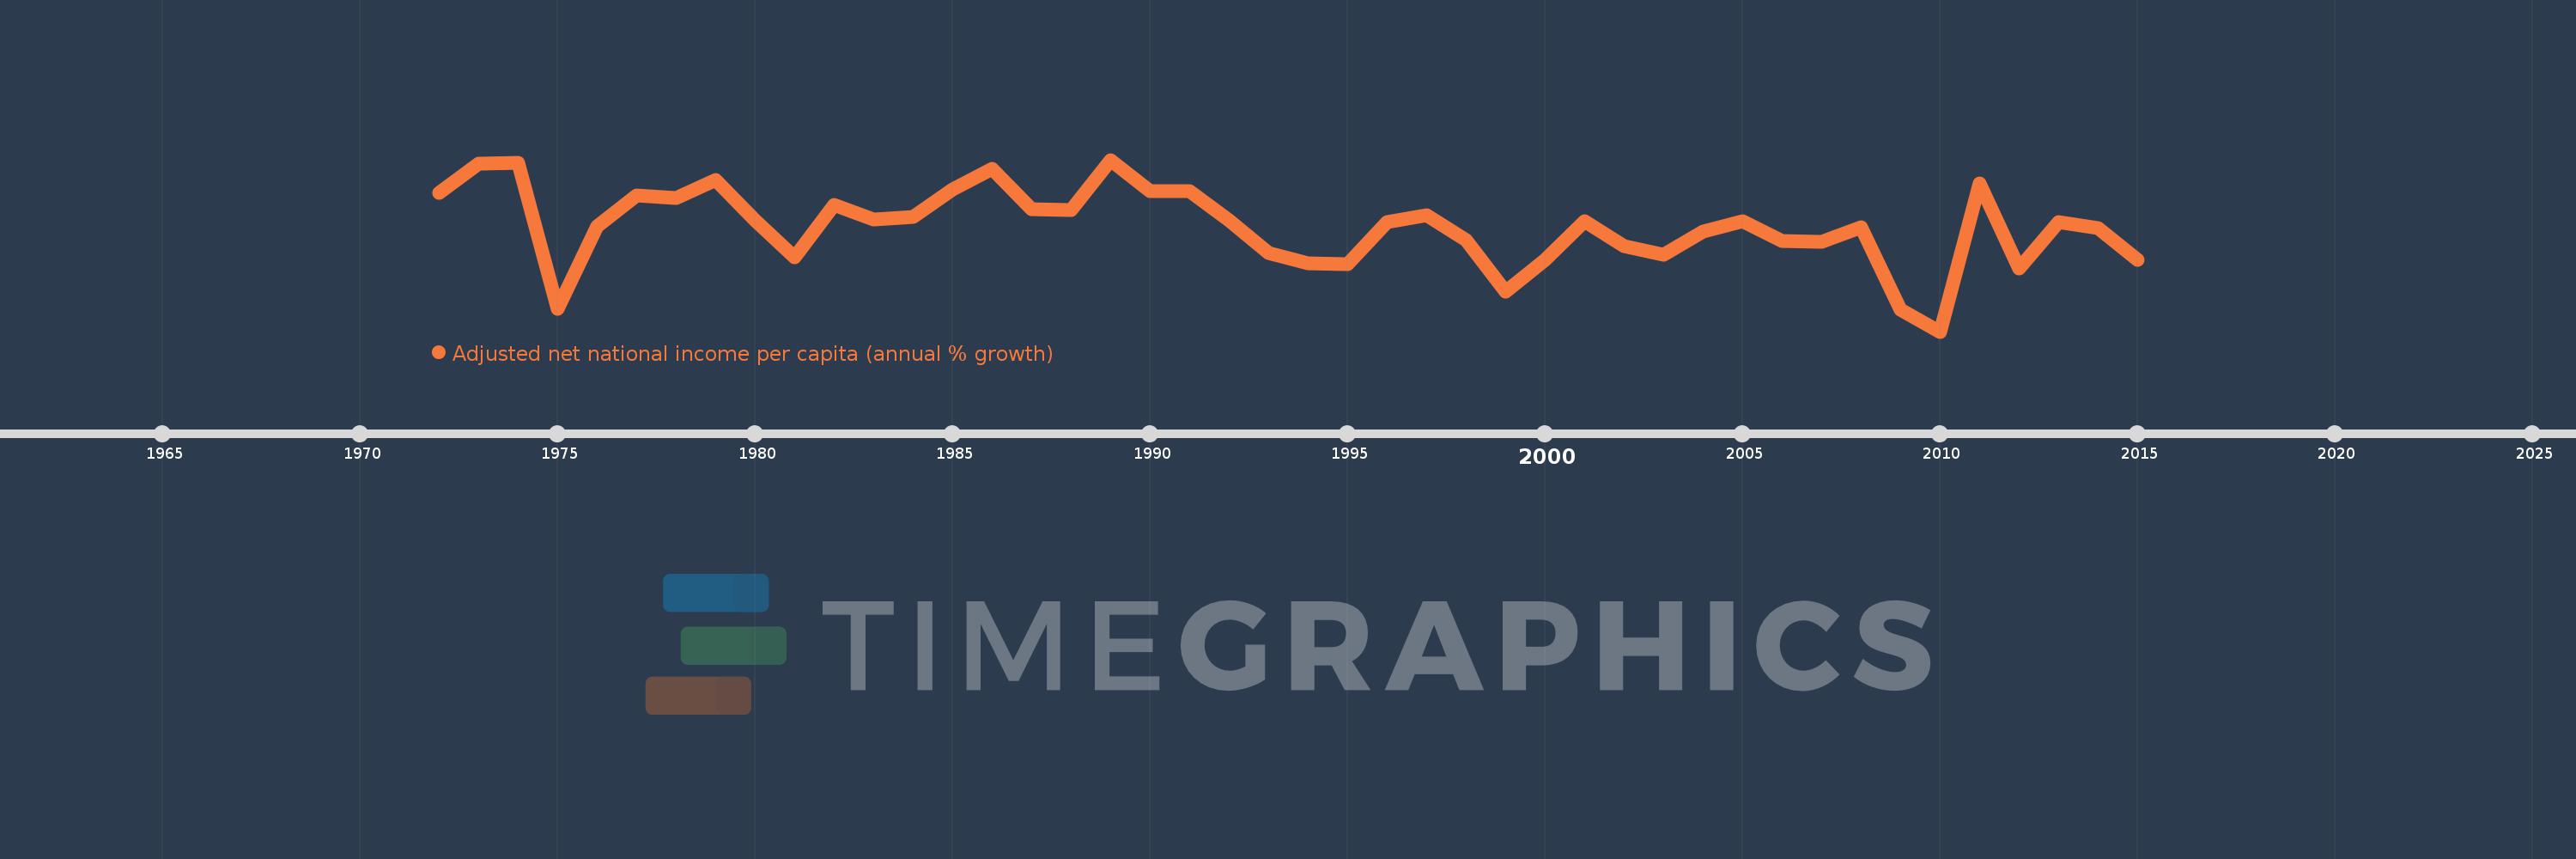
Adjusted net national income per capita (annual % growth)
2015,2014,2013,2012,2011,2010,2009,2008,2007,2006,2005,2004,2003,2002,2001,2000,1999,1998,1997,1996,1995,1994,1993,1992,1991,1990,1989,1988,1987,1986,1985,1984,1983,1982,1981,1980,1979,1978,1977,1976,1975,1974,1973,1972
Estas estatísticas em outros países:
Linha do tempo:
Nesta escala de tempo está apresentado um gráfico de 1972 ano até 2015 ano Japan. Dados de 1971 ano ausente. O número de observações reais por data: 44.
Fonte (nome):
Indicadores de desenvolvimento mundial
Fonte (organização):
World Bank staff estimates based on sources and methods in World Bank's "The Changing Wealth of Nations: Measuring Sustainable Development in the New Millennium" (2011).
Categorias:
Economy & Growth
Foi atualizado:
23 abr 2017 ano
Indicadores de alterações dos valores ao longo dos anos
Mínimo:
-5.774
1 jan 2010 ano
Máximo:
6.723
1 jan 1989 ano
Na data de observação
Valor
Mudança absoluta
A alteração em relação ao valor anterior
1 jan 1972 ano
4.31
+4.31
0.0%
1 jan 1973 ano
6.469
+2.158
50.08%
1 jan 1974 ano
6.508
+0.04
0.61%
1 jan 1975 ano
-4.14
-10.648
-163.61%
1 jan 1976 ano
1.903
+6.043
-145.97%
1 jan 1977 ano
4.151
+2.248
118.12%
1 jan 1978 ano
3.915
-0.236
-5.68%
1 jan 1979 ano
5.284
+1.369
34.98%
1 jan 1980 ano
2.333
-2.951
-55.84%
1 jan 1981 ano
-0.379
-2.713
-116.25%
1 jan 1982 ano
3.435
+3.814
-1.01 mil%
1 jan 1983 ano
2.4
-1.035
-30.13%
1 jan 1984 ano
2.538
+0.138
5.73%
1 jan 1985 ano
4.571
+2.033
80.13%
1 jan 1986 ano
6.083
+1.512
33.07%
1 jan 1987 ano
3.115
-2.968
-48.79%
1 jan 1988 ano
3.095
-0.02
-0.65%
1 jan 1989 ano
6.723
+3.628
117.24%
1 jan 1990 ano
4.415
-2.309
-34.34%
1 jan 1991 ano
4.427
+0.012
0.27%
1 jan 1992 ano
2.288
-2.138
-48.31%
1 jan 1993 ano
-0.08
-2.368
-103.48%
1 jan 1994 ano
-0.835
-0.755
948.14%
1 jan 1995 ano
-0.895
-0.06
7.18%
1 jan 1996 ano
2.196
+3.091
-345.52%
1 jan 1997 ano
2.679
+0.483
22.0%
1 jan 1998 ano
0.891
-1.788
-66.75%
1 jan 1999 ano
-2.85
-3.741
-419.9%
1 jan 2000 ano
-0.554
+2.296
-80.58%
1 jan 2001 ano
2.229
+2.783
-502.73%
1 jan 2002 ano
0.446
-1.783
-79.99%
1 jan 2003 ano
-0.174
-0.62
-139.01%
1 jan 2004 ano
1.528
+1.702
-977.82%
1 jan 2005 ano
2.264
+0.737
48.21%
1 jan 2006 ano
0.846
-1.418
-62.64%
1 jan 2007 ano
0.725
-0.121
-14.29%
1 jan 2008 ano
1.802
+1.077
148.53%
1 jan 2009 ano
-4.166
-5.968
-331.21%
1 jan 2010 ano
-5.774
-1.608
38.6%
1 jan 2011 ano
5.031
+10.805
-187.13%
1 jan 2012 ano
-1.194
-6.225
-123.73%
1 jan 2013 ano
2.174
+3.368
-282.09%
1 jan 2014 ano
1.75
-0.424
-19.52%
1 jan 2015 ano
-0.539
-2.289
-130.8%
Classificação de países por estatísticas atuais por anos


Comentários: