29
/pt/
pt
AIzaSyAYiBZKx7MnpbEhh9jyipgxe19OcubqV5w
April 1, 2024
235346
Senegal
SEN
true
2
1
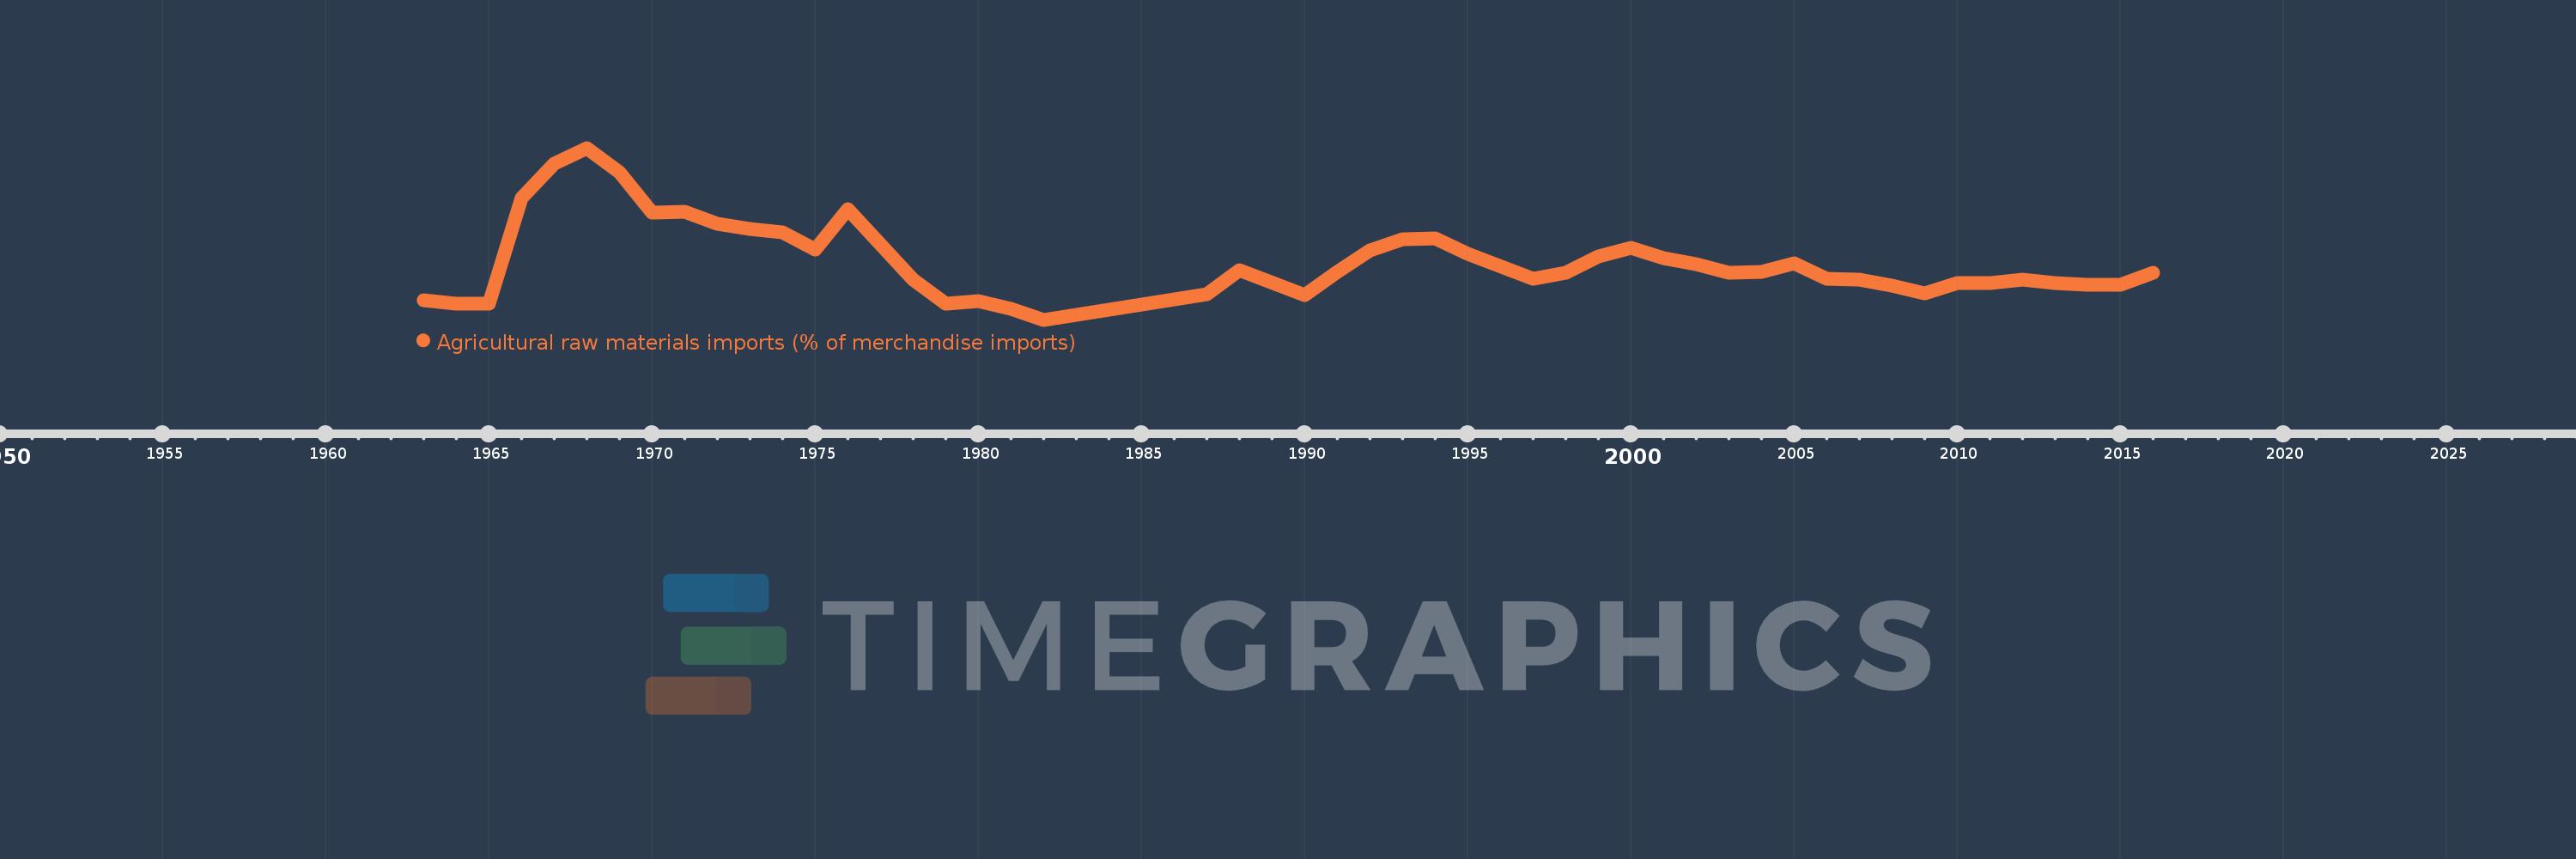
Agricultural raw materials imports (% of merchandise imports)
2016,2015,2014,2013,2012,2011,2010,2009,2008,2007,2006,2005,2004,2003,2002,2001,2000,1999,1998,1997,1995,1994,1993,1992,1991,1990,1988,1987,1982,1981,1980,1979,1978,1976,1975,1974,1973,1972,1971,1970,1969,1968,1967,1966,1965,1964,1963
Estas estatísticas em outros países:
AfghanistanAlbaniaAlgeriaAndorraAngolaAntigua and BarbudaArab WorldArgentinaArmeniaArubaAustraliaAustriaAzerbaijanBahamas, TheBahrainBangladeshBarbadosBelarusBelgiumBelizeBeninBermudaBhutanBoliviaBosnia and HerzegovinaBotswanaBrazilBrunei DarussalamBulgariaBurkina FasoBurundiCabo VerdeCambodiaCameroonCanadaCaribbean small statesCayman IslandsCentral African RepublicCentral Europe and the BalticsChadChileChinaColombiaComorosCongo, Dem. Rep.Congo, Rep.Costa RicaCote d'IvoireCroatiaCubaCyprusCzech RepublicDenmarkDjiboutiDominicaDominican RepublicEarly-demographic dividendEast Asia & PacificEast Asia & Pacific (excluding high income)East Asia & Pacific (IDA & IBRD countries)EcuadorEgypt, Arab Rep.El SalvadorEquatorial GuineaEritreaEstoniaEthiopiaEuro areaEurope & Central AsiaEurope & Central Asia (excluding high income)Europe & Central Asia (IDA & IBRD countries)European UnionFaroe IslandsFijiFinlandFragile and conflict affected situationsFranceFrench PolynesiaGabonGambia, TheGeorgiaGermanyGhanaGreeceGreenlandGrenadaGuatemalaGuineaGuinea-BissauGuyanaHaitiHeavily indebted poor countries (HIPC)High incomeHondurasHong Kong SAR, ChinaHungaryIBRD onlyIcelandIDA & IBRD totalIDA blendIDA onlyIDA totalIndiaIndonesiaIran, Islamic Rep.IraqIrelandIsraelItalyJamaicaJapanJordanKazakhstanKenyaKiribatiKorea, Rep.KuwaitKyrgyz RepublicLao PDRLate-demographic dividendLatin America & Caribbean Latin America & Caribbean (excluding high income)Latin America & the Caribbean (IDA & IBRD countries)LatviaLeast developed countries: UN classificationLebanonLesothoLiberiaLibyaLithuaniaLow & middle incomeLow incomeLower middle incomeLuxembourgMacao SAR, ChinaMacedonia, FYRMadagascarMalawiMalaysiaMaldivesMaliMaltaMauritaniaMauritiusMexicoMiddle East & North AfricaMiddle East & North Africa (excluding high income)Middle East & North Africa (IDA & IBRD countries)Middle incomeMoldovaMongoliaMoroccoMozambiqueMyanmarNamibiaNepalNetherlandsNew CaledoniaNew ZealandNicaraguaNigerNigeriaNorth AmericaNorwayOECD membersOmanOther small statesPacific island small statesPakistanPalauPanamaPapua New GuineaParaguayPeruPhilippinesPolandPortugalPost-demographic dividendPre-demographic dividendQatarRomaniaRussian FederationRwandaSamoaSao Tome and PrincipeSaudi ArabiaSenegalSerbiaSeychellesSierra LeoneSingaporeSlovak RepublicSloveniaSmall statesSolomon IslandsSomaliaSouth AfricaSouth AsiaSouth Asia (IDA & IBRD)SpainSri LankaSt. Kitts and NevisSt. LuciaSt. Vincent and the GrenadinesSub-Saharan Africa Sub-Saharan Africa (excluding high income)Sub-Saharan Africa (IDA & IBRD countries)SudanSurinameSwazilandSwedenSwitzerlandSyrian Arab RepublicTajikistanTanzaniaThailandTimor-LesteTogoTongaTrinidad and TobagoTunisiaTurkeyTurkmenistanTurks and Caicos IslandsTuvaluUgandaUkraineUnited Arab EmiratesUnited KingdomUnited StatesUpper middle incomeUruguayVanuatuVenezuela, RBVietnamVirgin Islands (U.S.)WorldYemen, Rep.ZambiaZimbabwe Linha do tempo:
Nesta escala de tempo está apresentado um gráfico de 1963 ano até 2016 ano Senegal. Dados de 1962 ano ausente. O número de observações reais por data: 47.
Fonte (nome):
Indicadores de desenvolvimento mundial
Fonte (organização):
World Bank staff estimates from the Comtrade database maintained by the United Nations Statistics Division.
Categorias:
Agriculture & Rural Development, Private Sector, Trade
Foi atualizado:
23 abr 2017 ano
Indicadores de alterações dos valores ao longo dos anos
Mínimo:
0.707
1 jan 1982 ano
Máximo:
4.528
1 jan 1968 ano
Na data de observação
Valor
Mudança absoluta
A alteração em relação ao valor anterior
1 jan 1963 ano
1.136
+1.136
0.0%
1 jan 1964 ano
1.069
-0.067
-5.93%
1 jan 1965 ano
1.06
-0.009
-0.8%
1 jan 1966 ano
3.406
+2.345
221.2%
1 jan 1967 ano
4.171
+0.766
22.48%
1 jan 1968 ano
4.528
+0.357
8.55%
1 jan 1969 ano
3.982
-0.546
-12.06%
1 jan 1970 ano
3.086
-0.896
-22.5%
1 jan 1971 ano
3.1
+0.014
0.45%
1 jan 1972 ano
2.84
-0.26
-8.38%
1 jan 1973 ano
2.727
-0.113
-3.99%
1 jan 1974 ano
2.642
-0.085
-3.11%
1 jan 1975 ano
2.269
-0.373
-14.11%
1 jan 1976 ano
3.164
+0.894
39.41%
1 jan 1978 ano
1.605
-1.558
-49.26%
1 jan 1979 ano
1.057
-0.548
-34.16%
1 jan 1980 ano
1.126
+0.069
6.52%
1 jan 1981 ano
0.947
-0.179
-15.87%
1 jan 1982 ano
0.707
-0.24
-25.39%
1 jan 1987 ano
1.267
+0.56
79.28%
1 jan 1988 ano
1.8
+0.533
42.1%
1 jan 1990 ano
1.26
-0.54
-30.02%
1 jan 1991 ano
1.778
+0.518
41.15%
1 jan 1992 ano
2.254
+0.475
26.74%
1 jan 1993 ano
2.488
+0.234
10.38%
1 jan 1994 ano
2.521
+0.034
1.35%
1 jan 1995 ano
2.163
-0.358
-14.19%
1 jan 1997 ano
1.619
-0.544
-25.15%
1 jan 1998 ano
1.752
+0.133
8.21%
1 jan 1999 ano
2.116
+0.364
20.75%
1 jan 2000 ano
2.315
+0.199
9.41%
1 jan 2001 ano
2.073
-0.242
-10.45%
1 jan 2002 ano
1.937
-0.136
-6.55%
1 jan 2003 ano
1.754
-0.183
-9.46%
1 jan 2004 ano
1.762
+0.008
0.46%
1 jan 2005 ano
1.962
+0.2
11.35%
1 jan 2006 ano
1.626
-0.336
-17.1%
1 jan 2007 ano
1.608
-0.018
-1.12%
1 jan 2008 ano
1.458
-0.15
-9.33%
1 jan 2009 ano
1.295
-0.163
-11.21%
1 jan 2010 ano
1.526
+0.231
17.86%
1 jan 2011 ano
1.517
-0.009
-0.58%
1 jan 2012 ano
1.605
+0.088
5.8%
1 jan 2013 ano
1.522
-0.083
-5.17%
1 jan 2014 ano
1.485
-0.037
-2.44%
1 jan 2015 ano
1.489
+0.004
0.29%
1 jan 2016 ano
1.752
+0.263
17.64%
Classificação de países por estatísticas atuais por anos


Comentários: