29
/pt/
pt
AIzaSyAYiBZKx7MnpbEhh9jyipgxe19OcubqV5w
April 1, 2024
167094
Kenya
KEN
true
2
1
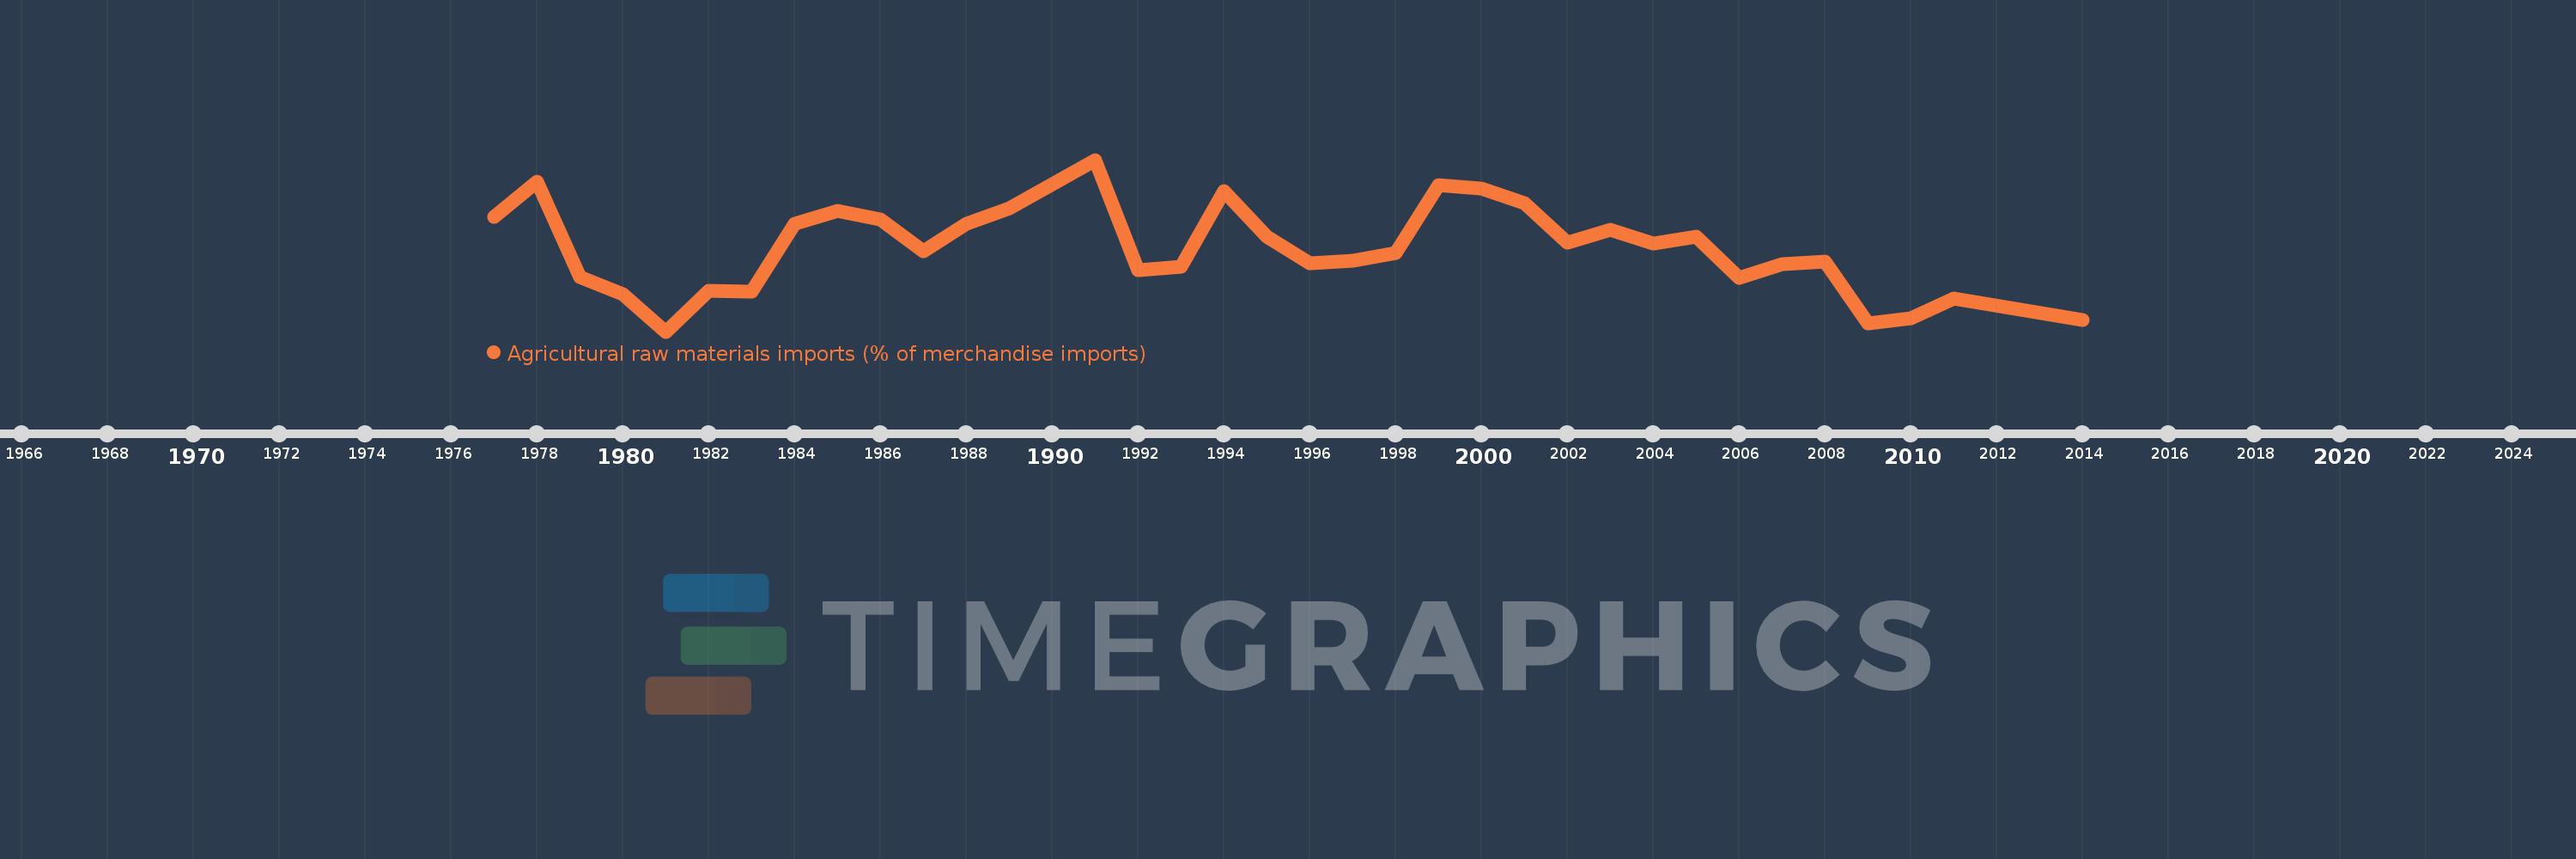
Agricultural raw materials imports (% of merchandise imports)
2014,2011,2010,2009,2008,2007,2006,2005,2004,2003,2002,2001,2000,1999,1998,1997,1996,1995,1994,1993,1992,1991,1989,1988,1987,1986,1985,1984,1983,1982,1981,1980,1979,1978,1977
Estas estatísticas em outros países:
AfghanistanAlbaniaAlgeriaAndorraAngolaAntigua and BarbudaArab WorldArgentinaArmeniaArubaAustraliaAustriaAzerbaijanBahamas, TheBahrainBangladeshBarbadosBelarusBelgiumBelizeBeninBermudaBhutanBoliviaBosnia and HerzegovinaBotswanaBrazilBrunei DarussalamBulgariaBurkina FasoBurundiCabo VerdeCambodiaCameroonCanadaCaribbean small statesCayman IslandsCentral African RepublicCentral Europe and the BalticsChadChileChinaColombiaComorosCongo, Dem. Rep.Congo, Rep.Costa RicaCote d'IvoireCroatiaCubaCyprusCzech RepublicDenmarkDjiboutiDominicaDominican RepublicEarly-demographic dividendEast Asia & PacificEast Asia & Pacific (excluding high income)East Asia & Pacific (IDA & IBRD countries)EcuadorEgypt, Arab Rep.El SalvadorEquatorial GuineaEritreaEstoniaEthiopiaEuro areaEurope & Central AsiaEurope & Central Asia (excluding high income)Europe & Central Asia (IDA & IBRD countries)European UnionFaroe IslandsFijiFinlandFragile and conflict affected situationsFranceFrench PolynesiaGabonGambia, TheGeorgiaGermanyGhanaGreeceGreenlandGrenadaGuatemalaGuineaGuinea-BissauGuyanaHaitiHeavily indebted poor countries (HIPC)High incomeHondurasHong Kong SAR, ChinaHungaryIBRD onlyIcelandIDA & IBRD totalIDA blendIDA onlyIDA totalIndiaIndonesiaIran, Islamic Rep.IraqIrelandIsraelItalyJamaicaJapanJordanKazakhstanKenyaKiribatiKorea, Rep.KuwaitKyrgyz RepublicLao PDRLate-demographic dividendLatin America & Caribbean Latin America & Caribbean (excluding high income)Latin America & the Caribbean (IDA & IBRD countries)LatviaLeast developed countries: UN classificationLebanonLesothoLiberiaLibyaLithuaniaLow & middle incomeLow incomeLower middle incomeLuxembourgMacao SAR, ChinaMacedonia, FYRMadagascarMalawiMalaysiaMaldivesMaliMaltaMauritaniaMauritiusMexicoMiddle East & North AfricaMiddle East & North Africa (excluding high income)Middle East & North Africa (IDA & IBRD countries)Middle incomeMoldovaMongoliaMoroccoMozambiqueMyanmarNamibiaNepalNetherlandsNew CaledoniaNew ZealandNicaraguaNigerNigeriaNorth AmericaNorwayOECD membersOmanOther small statesPacific island small statesPakistanPalauPanamaPapua New GuineaParaguayPeruPhilippinesPolandPortugalPost-demographic dividendPre-demographic dividendQatarRomaniaRussian FederationRwandaSamoaSao Tome and PrincipeSaudi ArabiaSenegalSerbiaSeychellesSierra LeoneSingaporeSlovak RepublicSloveniaSmall statesSolomon IslandsSomaliaSouth AfricaSouth AsiaSouth Asia (IDA & IBRD)SpainSri LankaSt. Kitts and NevisSt. LuciaSt. Vincent and the GrenadinesSub-Saharan Africa Sub-Saharan Africa (excluding high income)Sub-Saharan Africa (IDA & IBRD countries)SudanSurinameSwazilandSwedenSwitzerlandSyrian Arab RepublicTajikistanTanzaniaThailandTimor-LesteTogoTongaTrinidad and TobagoTunisiaTurkeyTurkmenistanTurks and Caicos IslandsTuvaluUgandaUkraineUnited Arab EmiratesUnited KingdomUnited StatesUpper middle incomeUruguayVanuatuVenezuela, RBVietnamVirgin Islands (U.S.)WorldYemen, Rep.ZambiaZimbabwe Linha do tempo:
Nesta escala de tempo está apresentado um gráfico de 1977 ano até 2014 ano Kenya. Dados de 1976 ano ausente. O número de observações reais por data: 35.
Fonte (nome):
Indicadores de desenvolvimento mundial
Fonte (organização):
World Bank staff estimates from the Comtrade database maintained by the United Nations Statistics Division.
Categorias:
Agriculture & Rural Development, Private Sector, Trade
Foi atualizado:
23 abr 2017 ano
Indicadores de alterações dos valores ao longo dos anos
Mínimo:
1.238
1 jan 1981 ano
Máximo:
2.865
1 jan 1991 ano
Na data de observação
Valor
Mudança absoluta
A alteração em relação ao valor anterior
1 jan 1977 ano
2.323
+2.323
0.0%
1 jan 1978 ano
2.656
+0.333
14.35%
1 jan 1979 ano
1.751
-0.905
-34.08%
1 jan 1980 ano
1.589
-0.162
-9.23%
1 jan 1981 ano
1.238
-0.352
-22.13%
1 jan 1982 ano
1.628
+0.391
31.59%
1 jan 1983 ano
1.616
-0.013
-0.79%
1 jan 1984 ano
2.258
+0.642
39.77%
1 jan 1985 ano
2.378
+0.12
5.3%
1 jan 1986 ano
2.3
-0.078
-3.27%
1 jan 1987 ano
2.0
-0.3
-13.05%
1 jan 1988 ano
2.261
+0.262
13.08%
1 jan 1989 ano
2.402
+0.14
6.21%
1 jan 1991 ano
2.865
+0.463
19.28%
1 jan 1992 ano
1.817
-1.048
-36.58%
1 jan 1993 ano
1.854
+0.037
2.06%
1 jan 1994 ano
2.568
+0.714
38.48%
1 jan 1995 ano
2.14
-0.428
-16.67%
1 jan 1996 ano
1.883
-0.257
-12.0%
1 jan 1997 ano
1.909
+0.026
1.39%
1 jan 1998 ano
1.98
+0.071
3.71%
1 jan 1999 ano
2.629
+0.649
32.78%
1 jan 2000 ano
2.594
-0.035
-1.34%
1 jan 2001 ano
2.453
-0.141
-5.42%
1 jan 2002 ano
2.083
-0.37
-15.08%
1 jan 2003 ano
2.206
+0.123
5.91%
1 jan 2004 ano
2.072
-0.134
-6.09%
1 jan 2005 ano
2.14
+0.068
3.28%
1 jan 2006 ano
1.748
-0.392
-18.31%
1 jan 2007 ano
1.878
+0.13
7.44%
1 jan 2008 ano
1.898
+0.019
1.03%
1 jan 2009 ano
1.312
-0.586
-30.89%
1 jan 2010 ano
1.361
+0.049
3.77%
1 jan 2011 ano
1.549
+0.188
13.85%
1 jan 2014 ano
1.344
-0.205
-13.25%
Classificação de países por estatísticas atuais por anos


Comentários: