29
/pt/
pt
AIzaSyAYiBZKx7MnpbEhh9jyipgxe19OcubqV5w
April 1, 2024
72695
Australia
AUS
true
2
1
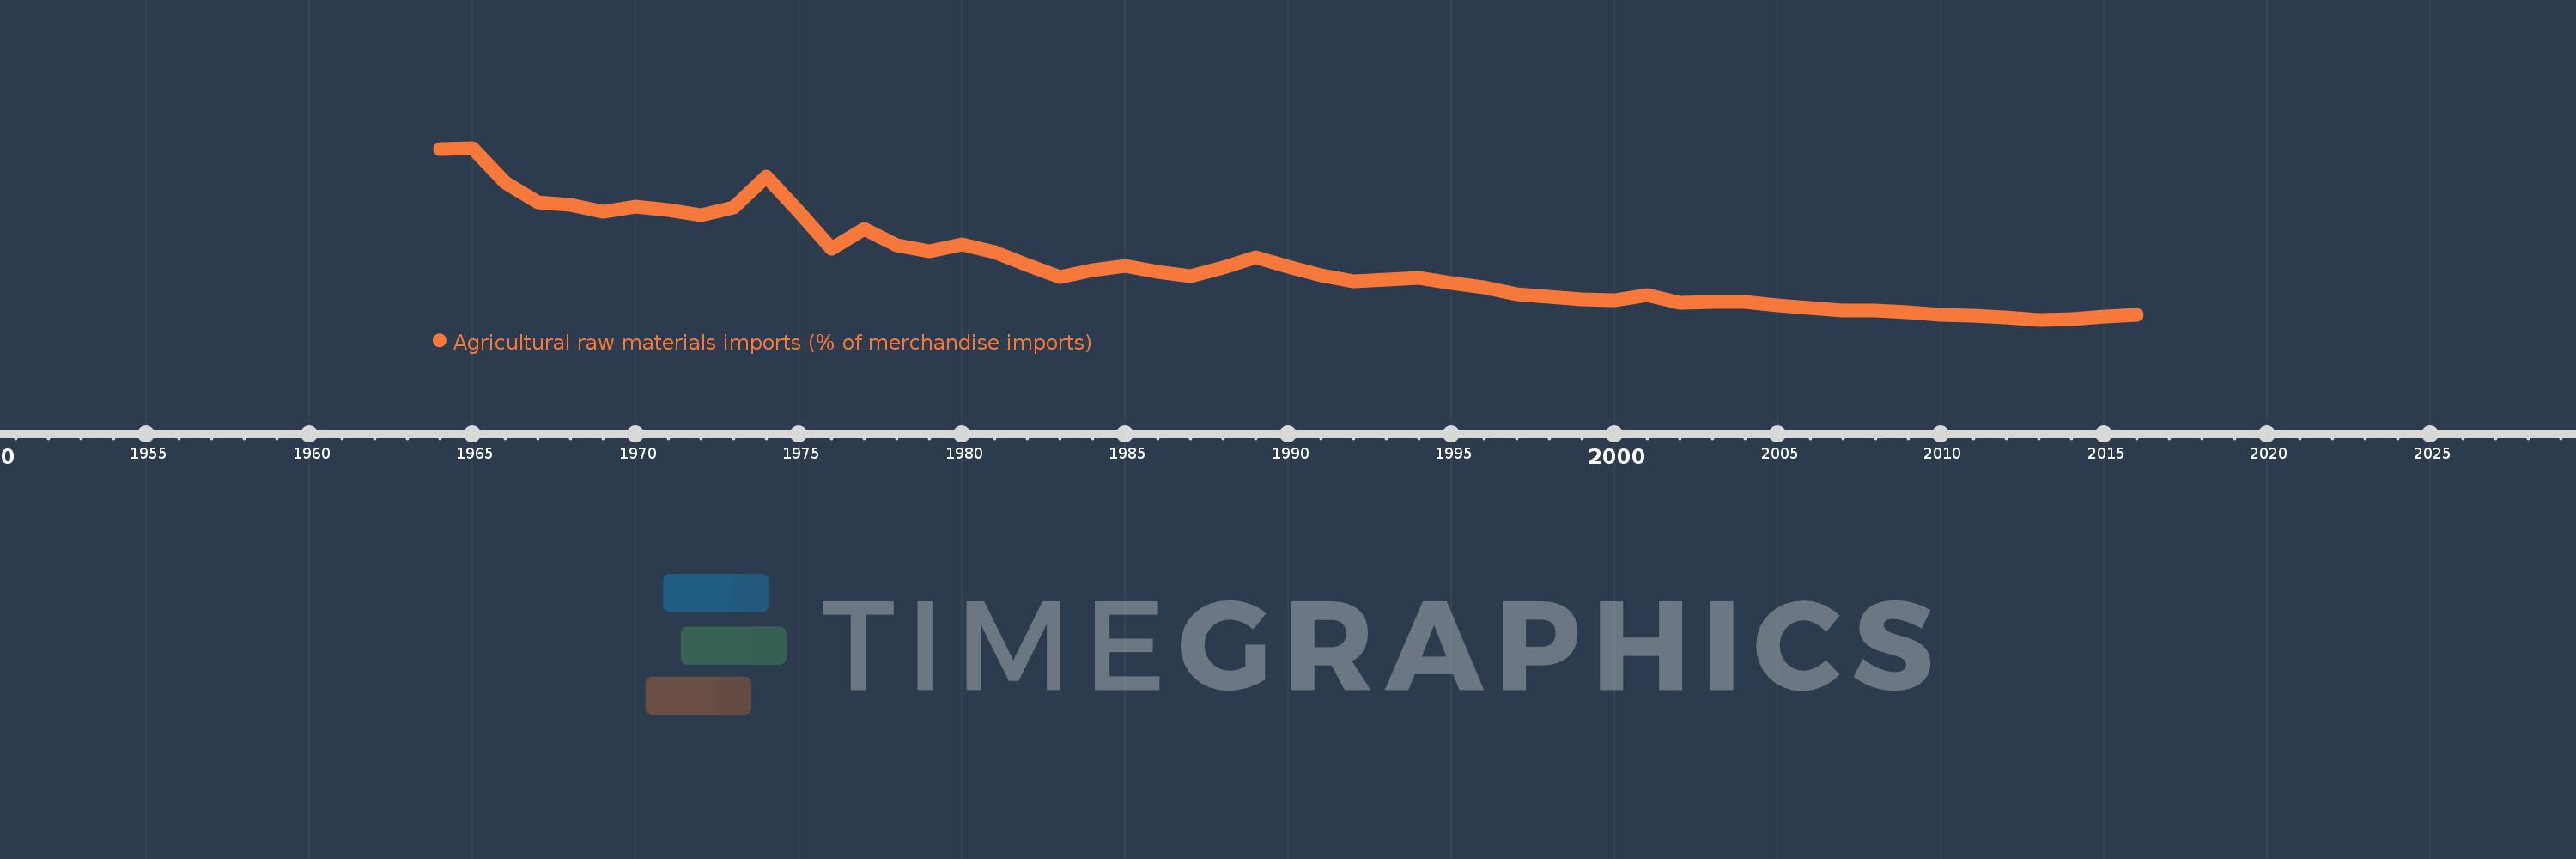
Agricultural raw materials imports (% of merchandise imports)
2016,2015,2014,2013,2012,2011,2010,2009,2008,2007,2006,2005,2004,2003,2002,2001,2000,1999,1998,1997,1996,1995,1994,1993,1992,1991,1990,1989,1988,1987,1986,1985,1984,1983,1982,1981,1980,1979,1978,1977,1976,1975,1974,1973,1972,1971,1970,1969,1968,1967,1966,1965,1964
Estas estatísticas em outros países:
AfghanistanAlbaniaAlgeriaAndorraAngolaAntigua and BarbudaArab WorldArgentinaArmeniaArubaAustraliaAustriaAzerbaijanBahamas, TheBahrainBangladeshBarbadosBelarusBelgiumBelizeBeninBermudaBhutanBoliviaBosnia and HerzegovinaBotswanaBrazilBrunei DarussalamBulgariaBurkina FasoBurundiCabo VerdeCambodiaCameroonCanadaCaribbean small statesCayman IslandsCentral African RepublicCentral Europe and the BalticsChadChileChinaColombiaComorosCongo, Dem. Rep.Congo, Rep.Costa RicaCote d'IvoireCroatiaCubaCyprusCzech RepublicDenmarkDjiboutiDominicaDominican RepublicEarly-demographic dividendEast Asia & PacificEast Asia & Pacific (excluding high income)East Asia & Pacific (IDA & IBRD countries)EcuadorEgypt, Arab Rep.El SalvadorEquatorial GuineaEritreaEstoniaEthiopiaEuro areaEurope & Central AsiaEurope & Central Asia (excluding high income)Europe & Central Asia (IDA & IBRD countries)European UnionFaroe IslandsFijiFinlandFragile and conflict affected situationsFranceFrench PolynesiaGabonGambia, TheGeorgiaGermanyGhanaGreeceGreenlandGrenadaGuatemalaGuineaGuinea-BissauGuyanaHaitiHeavily indebted poor countries (HIPC)High incomeHondurasHong Kong SAR, ChinaHungaryIBRD onlyIcelandIDA & IBRD totalIDA blendIDA onlyIDA totalIndiaIndonesiaIran, Islamic Rep.IraqIrelandIsraelItalyJamaicaJapanJordanKazakhstanKenyaKiribatiKorea, Rep.KuwaitKyrgyz RepublicLao PDRLate-demographic dividendLatin America & Caribbean Latin America & Caribbean (excluding high income)Latin America & the Caribbean (IDA & IBRD countries)LatviaLeast developed countries: UN classificationLebanonLesothoLiberiaLibyaLithuaniaLow & middle incomeLow incomeLower middle incomeLuxembourgMacao SAR, ChinaMacedonia, FYRMadagascarMalawiMalaysiaMaldivesMaliMaltaMauritaniaMauritiusMexicoMiddle East & North AfricaMiddle East & North Africa (excluding high income)Middle East & North Africa (IDA & IBRD countries)Middle incomeMoldovaMongoliaMoroccoMozambiqueMyanmarNamibiaNepalNetherlandsNew CaledoniaNew ZealandNicaraguaNigerNigeriaNorth AmericaNorwayOECD membersOmanOther small statesPacific island small statesPakistanPalauPanamaPapua New GuineaParaguayPeruPhilippinesPolandPortugalPost-demographic dividendPre-demographic dividendQatarRomaniaRussian FederationRwandaSamoaSao Tome and PrincipeSaudi ArabiaSenegalSerbiaSeychellesSierra LeoneSingaporeSlovak RepublicSloveniaSmall statesSolomon IslandsSomaliaSouth AfricaSouth AsiaSouth Asia (IDA & IBRD)SpainSri LankaSt. Kitts and NevisSt. LuciaSt. Vincent and the GrenadinesSub-Saharan Africa Sub-Saharan Africa (excluding high income)Sub-Saharan Africa (IDA & IBRD countries)SudanSurinameSwazilandSwedenSwitzerlandSyrian Arab RepublicTajikistanTanzaniaThailandTimor-LesteTogoTongaTrinidad and TobagoTunisiaTurkeyTurkmenistanTurks and Caicos IslandsTuvaluUgandaUkraineUnited Arab EmiratesUnited KingdomUnited StatesUpper middle incomeUruguayVanuatuVenezuela, RBVietnamVirgin Islands (U.S.)WorldYemen, Rep.ZambiaZimbabwe Linha do tempo:
Nesta escala de tempo está apresentado um gráfico de 1964 ano até 2016 ano Australia. Dados de 1963 ano ausente. O número de observações reais por data: 53.
Fonte (nome):
Indicadores de desenvolvimento mundial
Fonte (organização):
World Bank staff estimates from the Comtrade database maintained by the United Nations Statistics Division.
Categorias:
Agriculture & Rural Development, Private Sector, Trade
Foi atualizado:
23 abr 2017 ano
Indicadores de alterações dos valores ao longo dos anos
Mínimo:
0.564
1 jan 2013 ano
Máximo:
6.362
1 jan 1965 ano
Na data de observação
Valor
Mudança absoluta
A alteração em relação ao valor anterior
1 jan 1964 ano
6.315
+6.315
0.0%
1 jan 1965 ano
6.362
+0.047
0.74%
1 jan 1966 ano
5.19
-1.172
-18.42%
1 jan 1967 ano
4.539
-0.65
-12.53%
1 jan 1968 ano
4.435
-0.104
-2.29%
1 jan 1969 ano
4.218
-0.218
-4.91%
1 jan 1970 ano
4.381
+0.163
3.87%
1 jan 1971 ano
4.266
-0.115
-2.63%
1 jan 1972 ano
4.08
-0.186
-4.35%
1 jan 1973 ano
4.363
+0.283
6.93%
1 jan 1974 ano
5.395
+1.032
23.65%
1 jan 1975 ano
4.195
-1.199
-22.23%
1 jan 1976 ano
2.961
-1.234
-29.42%
1 jan 1977 ano
3.623
+0.662
22.35%
1 jan 1978 ano
3.065
-0.559
-15.41%
1 jan 1979 ano
2.878
-0.186
-6.08%
1 jan 1980 ano
3.101
+0.223
7.75%
1 jan 1981 ano
2.843
-0.258
-8.32%
1 jan 1982 ano
2.42
-0.423
-14.89%
1 jan 1983 ano
2.012
-0.408
-16.85%
1 jan 1984 ano
2.241
+0.229
11.4%
1 jan 1985 ano
2.395
+0.154
6.86%
1 jan 1986 ano
2.172
-0.223
-9.3%
1 jan 1987 ano
2.031
-0.141
-6.5%
1 jan 1988 ano
2.336
+0.305
14.99%
1 jan 1989 ano
2.675
+0.34
14.55%
1 jan 1990 ano
2.341
-0.335
-12.52%
1 jan 1991 ano
2.067
-0.273
-11.67%
1 jan 1992 ano
1.849
-0.218
-10.56%
1 jan 1993 ano
1.919
+0.07
3.77%
1 jan 1994 ano
1.981
+0.062
3.24%
1 jan 1995 ano
1.801
-0.18
-9.08%
1 jan 1996 ano
1.666
-0.135
-7.48%
1 jan 1997 ano
1.422
-0.244
-14.64%
1 jan 1998 ano
1.337
-0.085
-5.97%
1 jan 1999 ano
1.245
-0.092
-6.89%
1 jan 2000 ano
1.226
-0.02
-1.58%
1 jan 2001 ano
1.404
+0.179
14.59%
1 jan 2002 ano
1.122
-0.283
-20.14%
1 jan 2003 ano
1.167
+0.046
4.09%
1 jan 2004 ano
1.156
-0.011
-0.97%
1 jan 2005 ano
1.057
-0.099
-8.54%
1 jan 2006 ano
0.949
-0.108
-10.24%
1 jan 2007 ano
0.877
-0.072
-7.57%
1 jan 2008 ano
0.867
-0.01
-1.14%
1 jan 2009 ano
0.803
-0.064
-7.42%
1 jan 2010 ano
0.724
-0.079
-9.85%
1 jan 2011 ano
0.707
-0.017
-2.34%
1 jan 2012 ano
0.641
-0.066
-9.27%
1 jan 2013 ano
0.564
-0.077
-12.01%
1 jan 2014 ano
0.598
+0.034
6.03%
1 jan 2015 ano
0.68
+0.081
13.6%
1 jan 2016 ano
0.716
+0.037
5.39%
Classificação de países por estatísticas atuais por anos


Comentários: