29
/pt/
pt
AIzaSyAYiBZKx7MnpbEhh9jyipgxe19OcubqV5w
April 1, 2024
54558
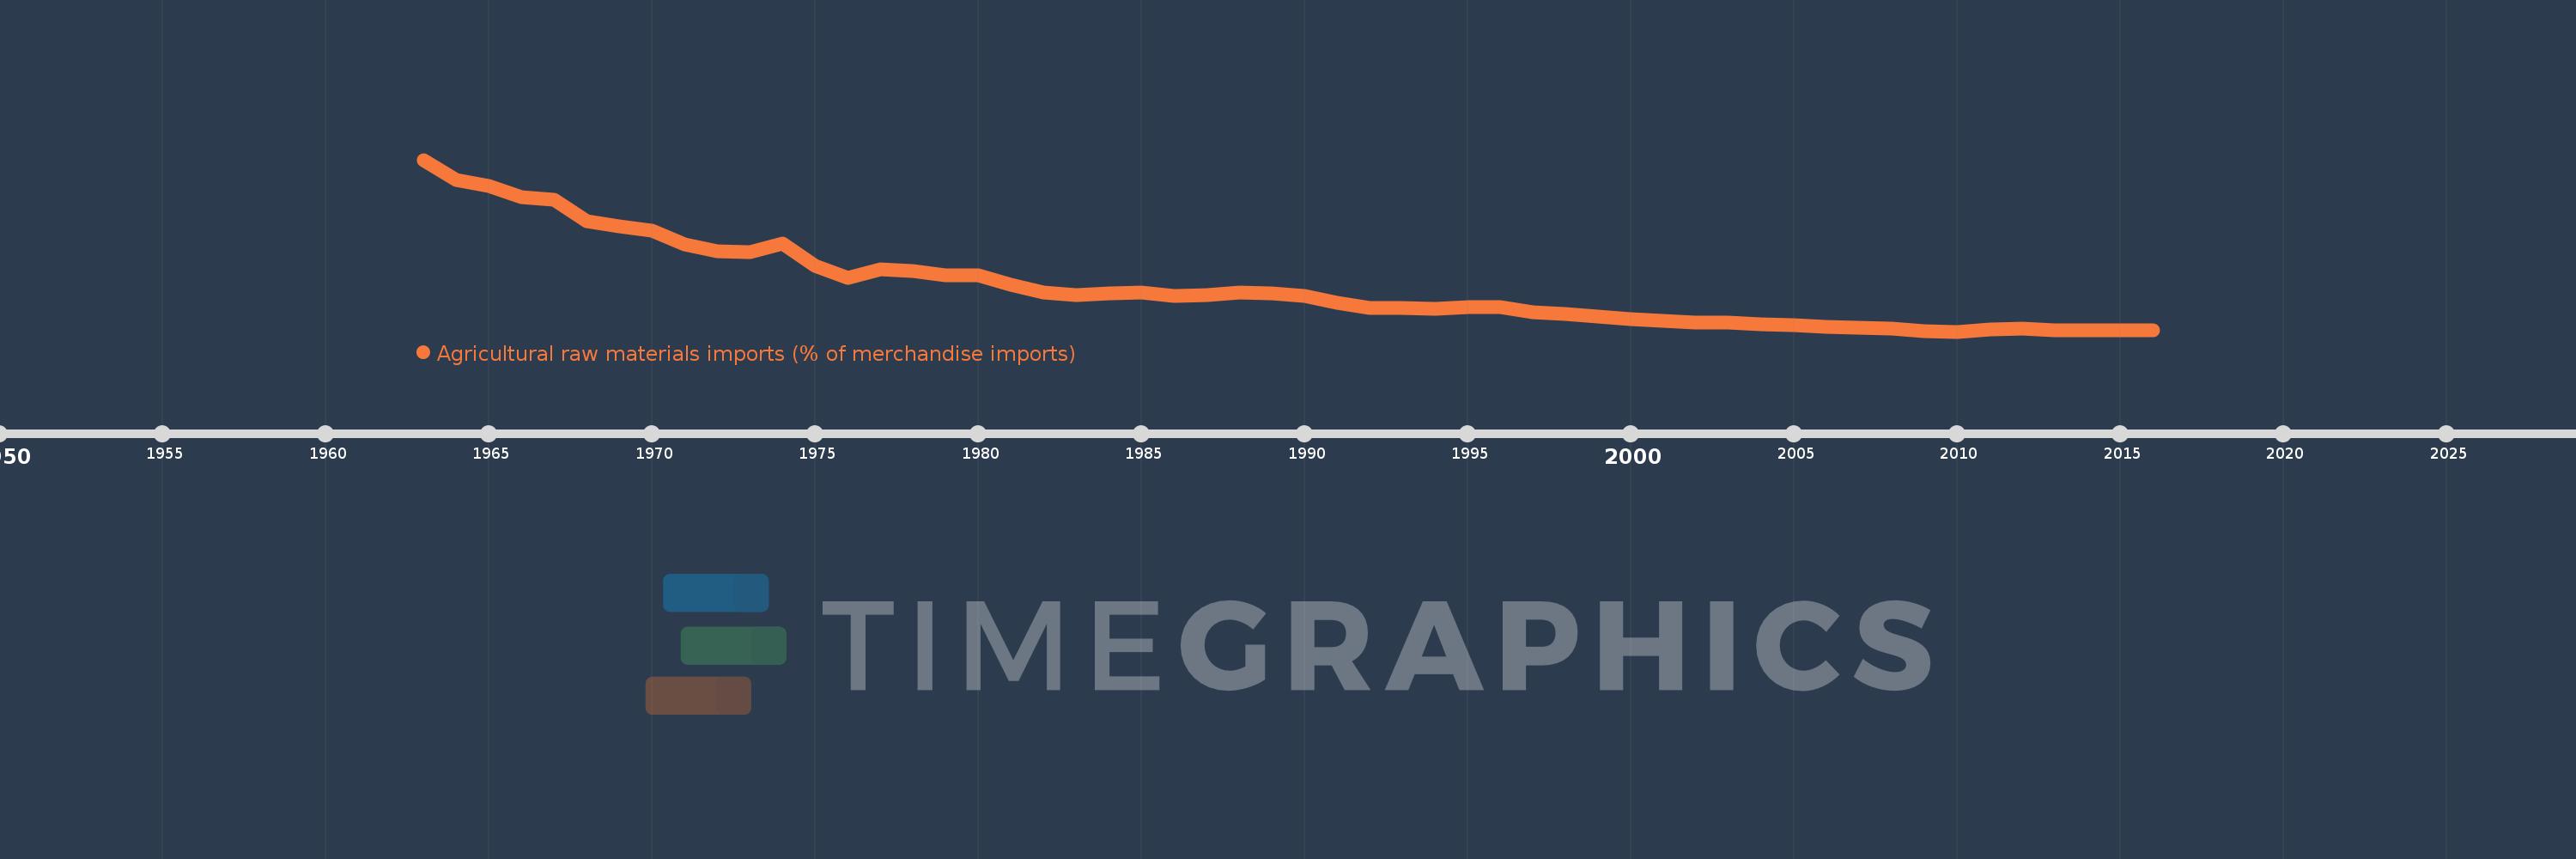
Post-demographic dividend
PST
false
2
1
Agricultural raw materials imports (% of merchandise imports)
2016,2015,2014,2013,2012,2011,2010,2009,2008,2007,2006,2005,2004,2003,2002,2001,2000,1999,1998,1997,1996,1995,1994,1993,1992,1991,1990,1989,1988,1987,1986,1985,1984,1983,1982,1981,1980,1979,1978,1977,1976,1975,1974,1973,1972,1971,1970,1969,1968,1967,1966,1965,1964,1963
Estas estatísticas em outros países:
AfghanistanAlbaniaAlgeriaAndorraAngolaAntigua and BarbudaArab WorldArgentinaArmeniaArubaAustraliaAustriaAzerbaijanBahamas, TheBahrainBangladeshBarbadosBelarusBelgiumBelizeBeninBermudaBhutanBoliviaBosnia and HerzegovinaBotswanaBrazilBrunei DarussalamBulgariaBurkina FasoBurundiCabo VerdeCambodiaCameroonCanadaCaribbean small statesCayman IslandsCentral African RepublicCentral Europe and the BalticsChadChileChinaColombiaComorosCongo, Dem. Rep.Congo, Rep.Costa RicaCote d'IvoireCroatiaCubaCyprusCzech RepublicDenmarkDjiboutiDominicaDominican RepublicEarly-demographic dividendEast Asia & PacificEast Asia & Pacific (excluding high income)East Asia & Pacific (IDA & IBRD countries)EcuadorEgypt, Arab Rep.El SalvadorEquatorial GuineaEritreaEstoniaEthiopiaEuro areaEurope & Central AsiaEurope & Central Asia (excluding high income)Europe & Central Asia (IDA & IBRD countries)European UnionFaroe IslandsFijiFinlandFragile and conflict affected situationsFranceFrench PolynesiaGabonGambia, TheGeorgiaGermanyGhanaGreeceGreenlandGrenadaGuatemalaGuineaGuinea-BissauGuyanaHaitiHeavily indebted poor countries (HIPC)High incomeHondurasHong Kong SAR, ChinaHungaryIBRD onlyIcelandIDA & IBRD totalIDA blendIDA onlyIDA totalIndiaIndonesiaIran, Islamic Rep.IraqIrelandIsraelItalyJamaicaJapanJordanKazakhstanKenyaKiribatiKorea, Rep.KuwaitKyrgyz RepublicLao PDRLate-demographic dividendLatin America & Caribbean Latin America & Caribbean (excluding high income)Latin America & the Caribbean (IDA & IBRD countries)LatviaLeast developed countries: UN classificationLebanonLesothoLiberiaLibyaLithuaniaLow & middle incomeLow incomeLower middle incomeLuxembourgMacao SAR, ChinaMacedonia, FYRMadagascarMalawiMalaysiaMaldivesMaliMaltaMauritaniaMauritiusMexicoMiddle East & North AfricaMiddle East & North Africa (excluding high income)Middle East & North Africa (IDA & IBRD countries)Middle incomeMoldovaMongoliaMoroccoMozambiqueMyanmarNamibiaNepalNetherlandsNew CaledoniaNew ZealandNicaraguaNigerNigeriaNorth AmericaNorwayOECD membersOmanOther small statesPacific island small statesPakistanPalauPanamaPapua New GuineaParaguayPeruPhilippinesPolandPortugalPost-demographic dividendPre-demographic dividendQatarRomaniaRussian FederationRwandaSamoaSao Tome and PrincipeSaudi ArabiaSenegalSerbiaSeychellesSierra LeoneSingaporeSlovak RepublicSloveniaSmall statesSolomon IslandsSomaliaSouth AfricaSouth AsiaSouth Asia (IDA & IBRD)SpainSri LankaSt. Kitts and NevisSt. LuciaSt. Vincent and the GrenadinesSub-Saharan Africa Sub-Saharan Africa (excluding high income)Sub-Saharan Africa (IDA & IBRD countries)SudanSurinameSwazilandSwedenSwitzerlandSyrian Arab RepublicTajikistanTanzaniaThailandTimor-LesteTogoTongaTrinidad and TobagoTunisiaTurkeyTurkmenistanTurks and Caicos IslandsTuvaluUgandaUkraineUnited Arab EmiratesUnited KingdomUnited StatesUpper middle incomeUruguayVanuatuVenezuela, RBVietnamVirgin Islands (U.S.)WorldYemen, Rep.ZambiaZimbabwe Linha do tempo:
Nesta escala de tempo está apresentado um gráfico de 1963 ano até 2016 ano Post-demographic dividend. Dados de 1962 ano ausente. O número de observações reais por data: 54.
Fonte (nome):
Indicadores de desenvolvimento mundial
Fonte (organização):
World Bank staff estimates from the Comtrade database maintained by the United Nations Statistics Division.
Categorias:
Agriculture & Rural Development, Private Sector, Trade
Foi atualizado:
23 abr 2017 ano
Indicadores de alterações dos valores ao longo dos anos
Mínimo:
1.149
1 jan 2010 ano
Máximo:
13.045
1 jan 1963 ano
Na data de observação
Valor
Mudança absoluta
A alteração em relação ao valor anterior
1 jan 1963 ano
13.045
+13.045
0.0%
1 jan 1964 ano
11.635
-1.409
-10.8%
1 jan 1965 ano
11.204
-0.432
-3.71%
1 jan 1966 ano
10.435
-0.769
-6.86%
1 jan 1967 ano
10.26
-0.175
-1.67%
1 jan 1968 ano
8.764
-1.496
-14.58%
1 jan 1969 ano
8.418
-0.346
-3.95%
1 jan 1970 ano
8.127
-0.292
-3.46%
1 jan 1971 ano
7.205
-0.921
-11.34%
1 jan 1972 ano
6.69
-0.515
-7.15%
1 jan 1973 ano
6.648
-0.042
-0.63%
1 jan 1974 ano
7.241
+0.593
8.92%
1 jan 1975 ano
5.675
-1.566
-21.63%
1 jan 1976 ano
4.86
-0.815
-14.35%
1 jan 1977 ano
5.471
+0.611
12.57%
1 jan 1978 ano
5.34
-0.131
-2.4%
1 jan 1979 ano
5.062
-0.278
-5.2%
1 jan 1980 ano
5.028
-0.034
-0.67%
1 jan 1981 ano
4.375
-0.654
-13.0%
1 jan 1982 ano
3.838
-0.537
-12.27%
1 jan 1983 ano
3.654
-0.184
-4.8%
1 jan 1984 ano
3.803
+0.149
4.08%
1 jan 1985 ano
3.87
+0.068
1.79%
1 jan 1986 ano
3.605
-0.265
-6.86%
1 jan 1987 ano
3.662
+0.057
1.58%
1 jan 1988 ano
3.861
+0.199
5.44%
1 jan 1989 ano
3.824
-0.037
-0.95%
1 jan 1990 ano
3.634
-0.19
-4.98%
1 jan 1991 ano
3.135
-0.499
-13.72%
1 jan 1992 ano
2.802
-0.333
-10.63%
1 jan 1993 ano
2.777
-0.025
-0.9%
1 jan 1994 ano
2.718
-0.058
-2.1%
1 jan 1995 ano
2.819
+0.1
3.69%
1 jan 1996 ano
2.846
+0.027
0.97%
1 jan 1997 ano
2.47
-0.376
-13.21%
1 jan 1998 ano
2.369
-0.101
-4.09%
1 jan 1999 ano
2.176
-0.193
-8.16%
1 jan 2000 ano
2.028
-0.148
-6.78%
1 jan 2001 ano
1.909
-0.119
-5.86%
1 jan 2002 ano
1.793
-0.116
-6.1%
1 jan 2003 ano
1.751
-0.041
-2.3%
1 jan 2004 ano
1.658
-0.093
-5.32%
1 jan 2005 ano
1.579
-0.079
-4.76%
1 jan 2006 ano
1.473
-0.106
-6.71%
1 jan 2007 ano
1.391
-0.082
-5.59%
1 jan 2008 ano
1.339
-0.052
-3.73%
1 jan 2009 ano
1.204
-0.135
-10.1%
1 jan 2010 ano
1.149
-0.055
-4.57%
1 jan 2011 ano
1.281
+0.133
11.54%
1 jan 2012 ano
1.33
+0.049
3.84%
1 jan 2013 ano
1.213
-0.117
-8.8%
1 jan 2014 ano
1.246
+0.033
2.71%
1 jan 2015 ano
1.223
-0.023
-1.83%
1 jan 2016 ano
1.211
-0.012
-0.98%
Classificação de países por estatísticas atuais por anos


Comentários: