29
/pt/
pt
AIzaSyAYiBZKx7MnpbEhh9jyipgxe19OcubqV5w
April 1, 2024
69451
Argentina
ARG
true
2
1
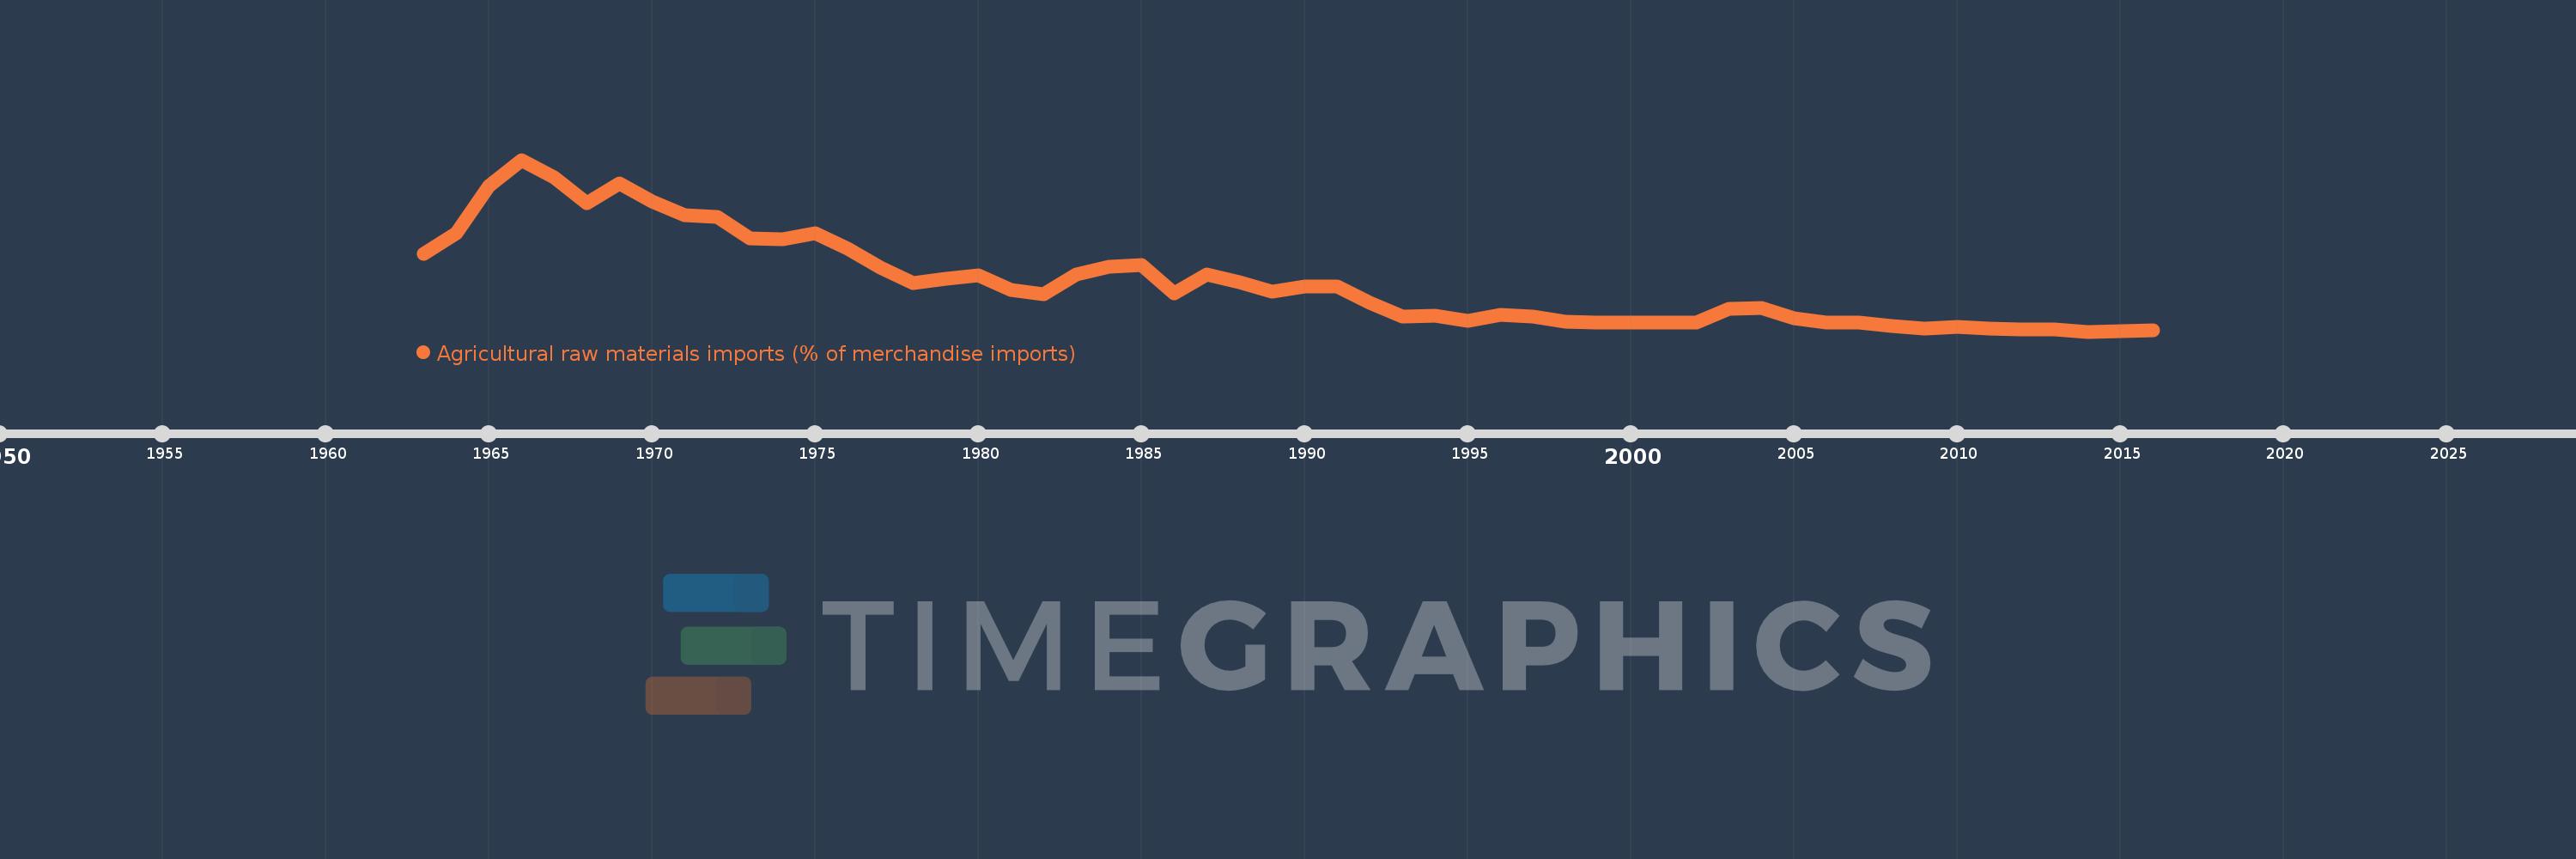
Agricultural raw materials imports (% of merchandise imports)
2016,2015,2014,2013,2012,2011,2010,2009,2008,2007,2006,2005,2004,2003,2002,2001,2000,1999,1998,1997,1996,1995,1994,1993,1992,1991,1990,1989,1988,1987,1986,1985,1984,1983,1982,1981,1980,1979,1978,1977,1976,1975,1974,1973,1972,1971,1970,1969,1968,1967,1966,1965,1964,1963
Estas estatísticas em outros países:
AfghanistanAlbaniaAlgeriaAndorraAngolaAntigua and BarbudaArab WorldArgentinaArmeniaArubaAustraliaAustriaAzerbaijanBahamas, TheBahrainBangladeshBarbadosBelarusBelgiumBelizeBeninBermudaBhutanBoliviaBosnia and HerzegovinaBotswanaBrazilBrunei DarussalamBulgariaBurkina FasoBurundiCabo VerdeCambodiaCameroonCanadaCaribbean small statesCayman IslandsCentral African RepublicCentral Europe and the BalticsChadChileChinaColombiaComorosCongo, Dem. Rep.Congo, Rep.Costa RicaCote d'IvoireCroatiaCubaCyprusCzech RepublicDenmarkDjiboutiDominicaDominican RepublicEarly-demographic dividendEast Asia & PacificEast Asia & Pacific (excluding high income)East Asia & Pacific (IDA & IBRD countries)EcuadorEgypt, Arab Rep.El SalvadorEquatorial GuineaEritreaEstoniaEthiopiaEuro areaEurope & Central AsiaEurope & Central Asia (excluding high income)Europe & Central Asia (IDA & IBRD countries)European UnionFaroe IslandsFijiFinlandFragile and conflict affected situationsFranceFrench PolynesiaGabonGambia, TheGeorgiaGermanyGhanaGreeceGreenlandGrenadaGuatemalaGuineaGuinea-BissauGuyanaHaitiHeavily indebted poor countries (HIPC)High incomeHondurasHong Kong SAR, ChinaHungaryIBRD onlyIcelandIDA & IBRD totalIDA blendIDA onlyIDA totalIndiaIndonesiaIran, Islamic Rep.IraqIrelandIsraelItalyJamaicaJapanJordanKazakhstanKenyaKiribatiKorea, Rep.KuwaitKyrgyz RepublicLao PDRLate-demographic dividendLatin America & Caribbean Latin America & Caribbean (excluding high income)Latin America & the Caribbean (IDA & IBRD countries)LatviaLeast developed countries: UN classificationLebanonLesothoLiberiaLibyaLithuaniaLow & middle incomeLow incomeLower middle incomeLuxembourgMacao SAR, ChinaMacedonia, FYRMadagascarMalawiMalaysiaMaldivesMaliMaltaMauritaniaMauritiusMexicoMiddle East & North AfricaMiddle East & North Africa (excluding high income)Middle East & North Africa (IDA & IBRD countries)Middle incomeMoldovaMongoliaMoroccoMozambiqueMyanmarNamibiaNepalNetherlandsNew CaledoniaNew ZealandNicaraguaNigerNigeriaNorth AmericaNorwayOECD membersOmanOther small statesPacific island small statesPakistanPalauPanamaPapua New GuineaParaguayPeruPhilippinesPolandPortugalPost-demographic dividendPre-demographic dividendQatarRomaniaRussian FederationRwandaSamoaSao Tome and PrincipeSaudi ArabiaSenegalSerbiaSeychellesSierra LeoneSingaporeSlovak RepublicSloveniaSmall statesSolomon IslandsSomaliaSouth AfricaSouth AsiaSouth Asia (IDA & IBRD)SpainSri LankaSt. Kitts and NevisSt. LuciaSt. Vincent and the GrenadinesSub-Saharan Africa Sub-Saharan Africa (excluding high income)Sub-Saharan Africa (IDA & IBRD countries)SudanSurinameSwazilandSwedenSwitzerlandSyrian Arab RepublicTajikistanTanzaniaThailandTimor-LesteTogoTongaTrinidad and TobagoTunisiaTurkeyTurkmenistanTurks and Caicos IslandsTuvaluUgandaUkraineUnited Arab EmiratesUnited KingdomUnited StatesUpper middle incomeUruguayVanuatuVenezuela, RBVietnamVirgin Islands (U.S.)WorldYemen, Rep.ZambiaZimbabwe Linha do tempo:
Nesta escala de tempo está apresentado um gráfico de 1963 ano até 2016 ano Argentina. Dados de 1962 ano ausente. O número de observações reais por data: 54.
Fonte (nome):
Indicadores de desenvolvimento mundial
Fonte (organização):
World Bank staff estimates from the Comtrade database maintained by the United Nations Statistics Division.
Categorias:
Agriculture & Rural Development, Private Sector, Trade
Foi atualizado:
23 abr 2017 ano
Indicadores de alterações dos valores ao longo dos anos
Mínimo:
0.865
1 jan 2014 ano
Máximo:
12.601
1 jan 1966 ano
Na data de observação
Valor
Mudança absoluta
A alteração em relação ao valor anterior
1 jan 1963 ano
6.147
+6.147
0.0%
1 jan 1964 ano
7.568
+1.421
23.12%
1 jan 1965 ano
10.813
+3.245
42.87%
1 jan 1966 ano
12.601
+1.788
16.54%
1 jan 1967 ano
11.419
-1.182
-9.38%
1 jan 1968 ano
9.626
-1.793
-15.7%
1 jan 1969 ano
10.964
+1.339
13.91%
1 jan 1970 ano
9.74
-1.224
-11.16%
1 jan 1971 ano
8.814
-0.926
-9.51%
1 jan 1972 ano
8.685
-0.13
-1.47%
1 jan 1973 ano
7.226
-1.458
-16.79%
1 jan 1974 ano
7.201
-0.025
-0.35%
1 jan 1975 ano
7.611
+0.41
5.69%
1 jan 1976 ano
6.538
-1.073
-14.1%
1 jan 1977 ano
5.256
-1.282
-19.61%
1 jan 1978 ano
4.167
-1.088
-20.71%
1 jan 1979 ano
4.49
+0.322
7.74%
1 jan 1980 ano
4.689
+0.199
4.43%
1 jan 1981 ano
3.711
-0.978
-20.86%
1 jan 1982 ano
3.407
-0.303
-8.17%
1 jan 1983 ano
4.763
+1.356
39.79%
1 jan 1984 ano
5.305
+0.541
11.37%
1 jan 1985 ano
5.401
+0.096
1.81%
1 jan 1986 ano
3.474
-1.927
-35.67%
1 jan 1987 ano
4.751
+1.277
36.76%
1 jan 1988 ano
4.219
-0.533
-11.22%
1 jan 1989 ano
3.589
-0.63
-14.93%
1 jan 1990 ano
3.952
+0.363
10.12%
1 jan 1991 ano
3.958
+0.006
0.16%
1 jan 1992 ano
2.811
-1.146
-28.97%
1 jan 1993 ano
1.906
-0.905
-32.2%
1 jan 1994 ano
1.922
+0.016
0.84%
1 jan 1995 ano
1.616
-0.307
-15.95%
1 jan 1996 ano
2.034
+0.418
25.88%
1 jan 1997 ano
1.913
-0.12
-5.92%
1 jan 1998 ano
1.545
-0.368
-19.23%
1 jan 1999 ano
1.497
-0.048
-3.13%
1 jan 2000 ano
1.504
+0.007
0.46%
1 jan 2001 ano
1.484
-0.02
-1.3%
1 jan 2002 ano
1.509
+0.024
1.63%
1 jan 2003 ano
2.403
+0.895
59.29%
1 jan 2004 ano
2.485
+0.082
3.4%
1 jan 2005 ano
1.789
-0.696
-28.0%
1 jan 2006 ano
1.503
-0.286
-16.01%
1 jan 2007 ano
1.476
-0.027
-1.79%
1 jan 2008 ano
1.238
-0.238
-16.1%
1 jan 2009 ano
1.058
-0.18
-14.55%
1 jan 2010 ano
1.163
+0.105
9.96%
1 jan 2011 ano
1.084
-0.079
-6.83%
1 jan 2012 ano
1.03
-0.054
-4.95%
1 jan 2013 ano
1.029
-0.001
-0.09%
1 jan 2014 ano
0.865
-0.164
-15.97%
1 jan 2015 ano
0.889
+0.024
2.73%
1 jan 2016 ano
0.93
+0.041
4.61%
Classificação de países por estatísticas atuais por anos


Comentários: